
What is Java Profiling?
Java profiling is the process of analyzing Java performance in order to identify bottlenecks and optimize Java applications.
Profiling involves collecting data about the application’s behavior, such as the amount of time spent executing different parts of the code, the number of times certain methods are called, and the amount of memory and other resources that are being used. This data can then be used to identify areas of the code that are causing performance issues, and to optimize those areas to improve the overall performance of the application.

There are a number of tools available for Java profiling, both commercial and open-source. We’ll cover 6 tools later in this article, including JProfiler, NetBeans Profiler, and our own Intel Granulate Continuous Profiler. These tools allow you to collect data about the performance of your application and visualize it in a way that makes it easy to understand and identify performance issues. Some common features of Java profiling tools include the ability to:
- Collect data about the execution time of different parts of the code
- Monitor the use of resources such as memory, CPU, and network bandwidth
- Identify and analyze performance bottlenecks
- Generate reports and visualizations of the collected data
In this article:
Why Is Java Profiling Important?
Code profiling tools can be an invaluable tool for Java developers looking to optimize the performance, efficiency, and reliability of their applications. There are several reasons why a Java developer might use a code profiling tool:
- To identify performance bottlenecks: Code profiling tools can help you identify areas of the code that are causing performance issues, such as slow execution times or high resource consumption. This can help you optimize the performance of your application and improve its efficiency.
- To optimize code efficiency: Code profiling tools can help you identify areas of the code that are inefficient, such as algorithms that are taking longer to execute than necessary. By optimizing these areas of the code, you can improve the overall efficiency of the application.
- To optimize resource utilization: Code profiling tools can help you identify areas of the code that are consuming a large amount of resources, such as memory or CPU time. By optimizing these areas of the code, you can improve the overall resource utilization of the application.
- To identify and fix bugs: Code profiling tools can help you identify areas of the code that are causing errors or exceptions, which can help you fix bugs and improve the reliability of the application.
Related content: Read our guide to Python vs Java performance
3 Key Areas of Java Profiling
Java CPU Profiling
Java CPU profiling is the process of analyzing the use of the CPU by a Java application in order to identify performance bottlenecks and optimize its performance. Java profilers collect and analyze multiple metrics, which allow you to identify performance bottlenecks and optimize the performance of your application.
Most Java profilers collect the following metrics related to CPU utilization and performance:
- Utilization: This refers to the percentage of time that the CPU is being used by the application. A high utilization rate can indicate that the application is using the CPU efficiently, but it can also be a sign of a performance bottleneck if the application is using more CPU than is available.
- Throughput: This refers to the rate at which the application is able to process requests or complete tasks. A high throughput rate is generally a good sign, as it indicates that the application is able to handle a large volume of requests or tasks in a short period of time.
- Turnaround time: This is the amount of time it takes for the application to complete a task or request. A high turnaround time can indicate a performance bottleneck, as it means that the application is taking longer to complete tasks than desired.
- Waiting time: This is the amount of time that the application spends waiting for resources to become available, such as waiting for input/output operations to complete or waiting for memory to be freed up. A high waiting time can indicate a performance bottleneck, as it means that the application is not able to make full use of available resources.
- Load average: This is a measure of the average workload of the system over a specific period of time. A high load average can indicate that the system is under a heavy workload, which can lead to performance issues.
- Response time: This is the amount of time it takes for the application to respond to a request or task. A high response time can indicate a performance bottleneck, as it means that the application is taking longer than desired to respond to requests.
Java Memory Profiling
Java memory profiling is the process of analyzing the use of memory by a Java application in order to identify performance bottlenecks and resolve memory leaks. There are a few ways Java profilers can help optimize memory usage of a Java application, including:
- Tracking memory allocation: This involves monitoring the allocation of memory to different parts of the application, and identifying areas of the code that are using a large amount of memory. This can help you identify areas of the code that may be causing memory leaks or other performance issues.
- Capturing heap dumps: A heap dump is a snapshot of the memory usage of a Java application at a specific point in time. By capturing heap dumps at different points during the execution of the application, you can analyze the memory usage of the application and identify areas of the code that are using a large amount of memory.
- Tracking garbage collection activity: Garbage collection is the process by which the Java Virtual Machine (JVM) reclaims memory that is no longer being used by the application. By tracking garbage collection activity, you can identify areas of the code that are causing the JVM to perform a large number of garbage collections, which can impact the performance of the application.
- Monitoring object creation: This involves monitoring the creation and destruction of objects within the application, and identifying areas of the code that are creating a large number of objects or holding on to objects for longer than necessary. This can help you identify areas of the code that may be causing memory leaks or other performance issues.
Thread Profiling
In a multi-threaded Java application, it is important to monitor a thread’s life cycle to avoid possible race conditions or monitor contention. You can periodically capture the stack traces of all currently alive threads to get a better understanding of the state of your application.
To monitor contention, you can perform monitor profiling which will help you analyze synchronization issues such as the calling of the wait() method by threads and the time they took to come out of it. This will also uncover the threads that are blocked trying to acquire a monitor held by another thread, and the time they took to come out of it. For example, you can use monitor profiling to analyze the behavior of synchronized blocks and methods.
In addition to monitoring the life cycle and contention of threads, you can also collect information about CPU consumption from threads. This can help you identify threads that are using a large amount of CPU time, which can indicate a performance bottleneck. By monitoring these metrics, you can get a better understanding of the performance of your application and take steps to optimize its performance.
Notable Java Profiling Tools
1. JProfiler
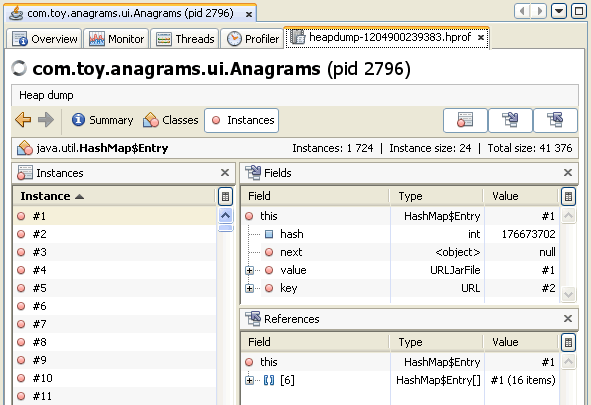
JProfiler is an open source profiling tool for Java applications. It can perform live profiling of both local and remote Java sessions, which is particularly useful for diagnosing problems in production environments.
It also provides a Heap Walker, with a set of views that let you understand memory usage in your application, identify memory leaks and excessive object allocation.
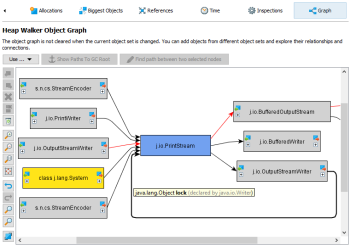
Source: EJ Technologies
JProfiler also provides data visualization capabilities. It can display profiling data as graphs, tables, and trees, making it easier to understand the performance characteristics of your application.
2. NetBeans Profiler

NetBeans Profiler is a module of the NetBeans IDE. It allows you to monitor thread state, CPU performance, and memory usage of your Java applications. Users of NetBeans can start profiling applications with a few clicks and view the results directly in the IDE.
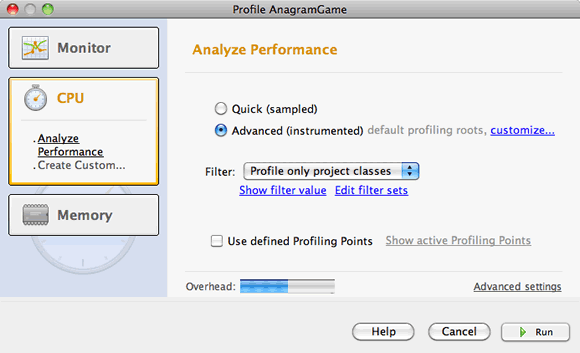
Source: NetBeans
NetBeans provides three main types of profiling:
- CPU profiling: Monitoring CPU usage of applications, showing you how much time each method takes to execute. This can help you identify bottlenecks and optimize your code for better performance.
- Memory profiling: Tracking object creation and garbage collection. You can view the number of objects created, their size, and their lifespan. This can help you identify memory leaks and optimize your application’s memory usage.
- Thread profiling: Monitoring the state of each thread in your application, showing you the threads that are running, blocked, or waiting. This can help you identify issues with concurrency and improve the overall performance of your application.
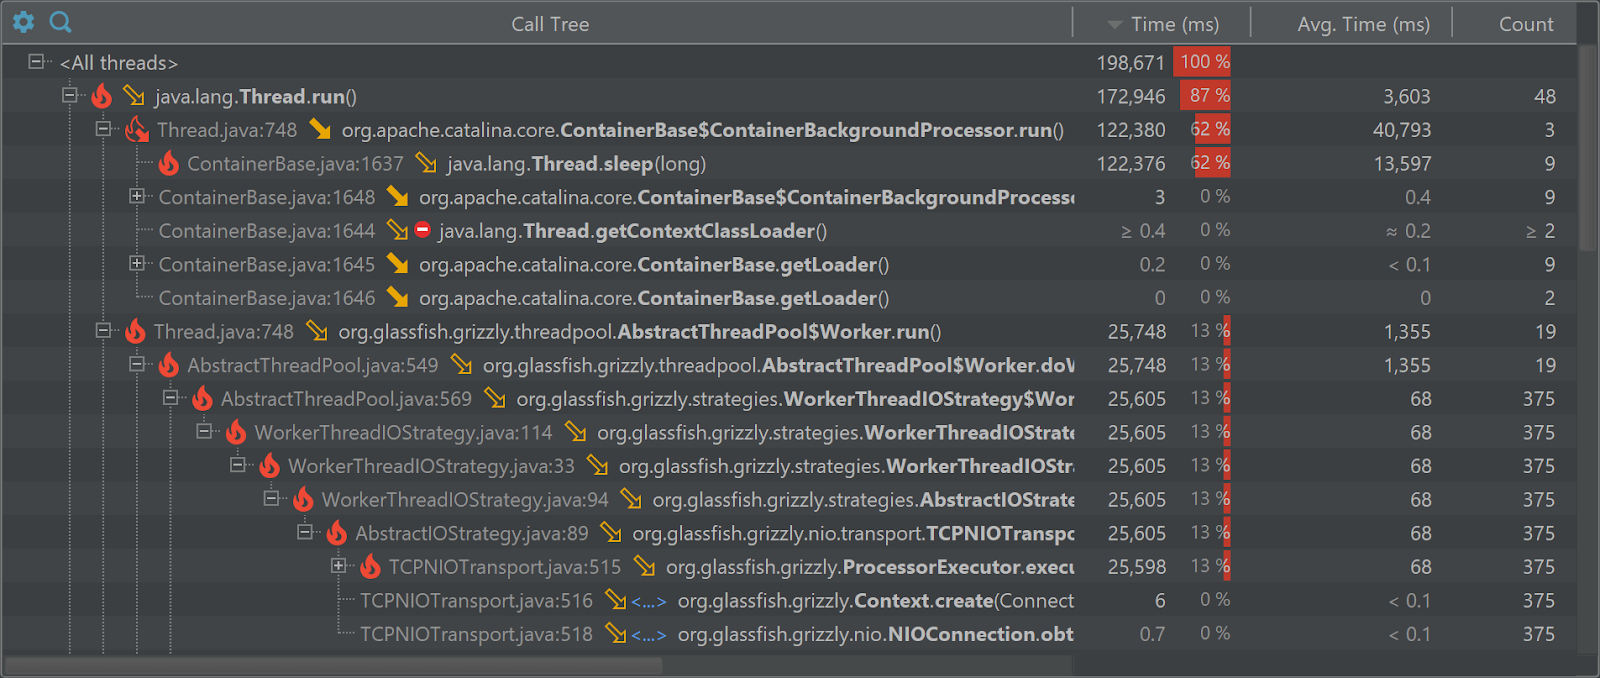
3. IntelliJ Profiler

IntelliJ Profiler is a part of the IntelliJ IDEA. It lets you analyze performance directly from the IDEA, and integrates with other profiling tools like YourKit, VisualVM, and JProfiler. Like NetBeans, IntelliJ Profiler offers CPU profiling, memory profiling, and threat profiling capabilities.
Source: JetBrains
4. VisualVM Java Profiler

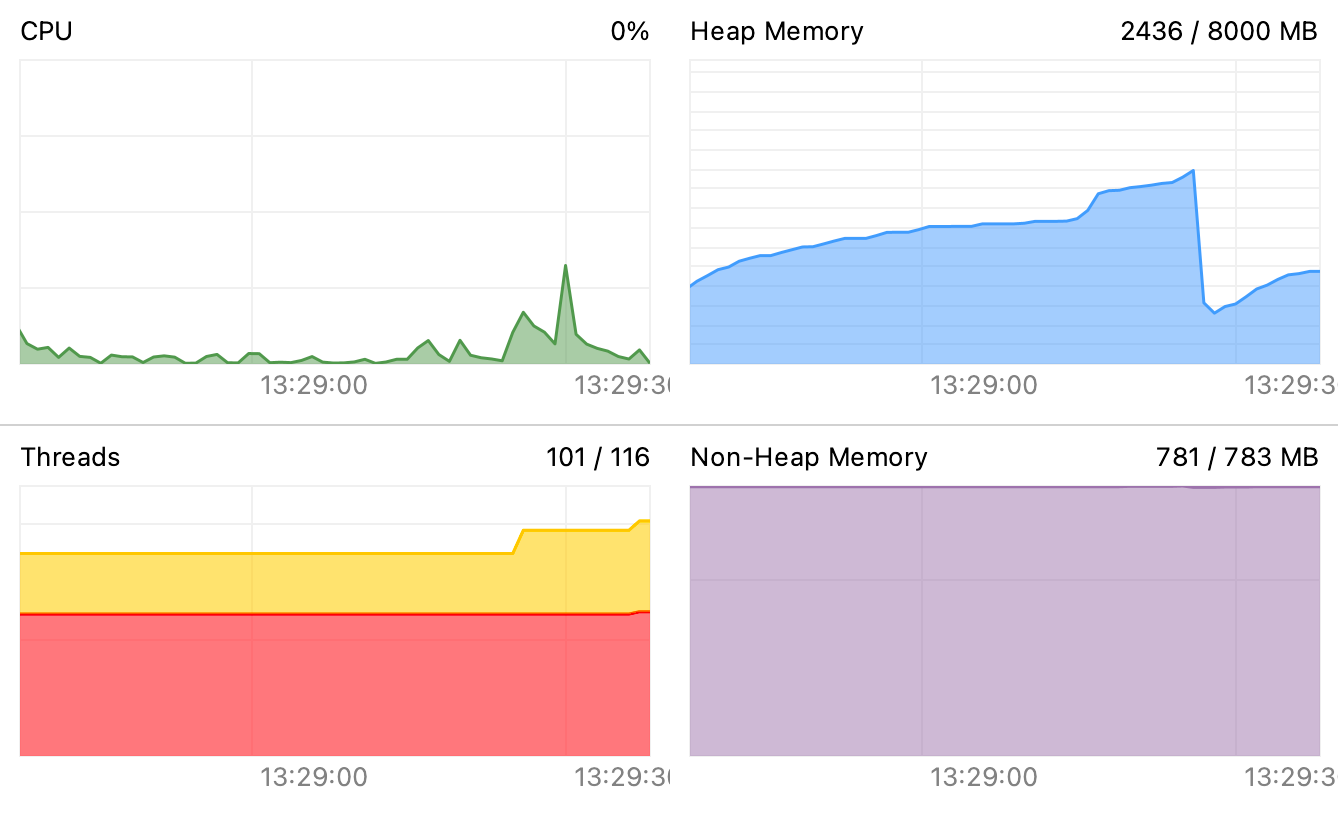
VisualVM is a visual tool that integrates several command-line JDK tools and lightweight profiling capabilities. It’s provides a performance overview of Java applications while they are running on a Java Virtual Machine (JVM).
Source: VisualVM
VisualVM lets you see stats related to CPU, memory, threads, and classes. You can also view the heap and garbage collection. It also lets you take snapshots of the profiling session for later analysis. VisualVM is a customizable tool, with many plugins available that can enhance its functionality. You can even develop your own plugins for unique use cases.
5. YourKit JVM Profiler

YourKit JVM Profiler focuses on CPU and memory profiling. It provides comprehensive information about CPU usage and memory allocation. The profiler can identify the most CPU-consuming threads and monitor memory leaks, helping you optimize your application’s performance.
Source: YourKit
YourKit also provides exception profiling. This feature enables you to track down problematic exceptions in your code. It provides a detailed list of all thrown exceptions, including their frequency and location in your code.
6. Intel Granulate Continuous Profiler
Intel Granulate Continuous Profiling is a free and open source Java profiler with an always-on approach. It samples the CPU, allowing you to investigate performance at any given time to see the impact of version releases, understand the performance impact of new features, compare deployments and isolate performance issues.
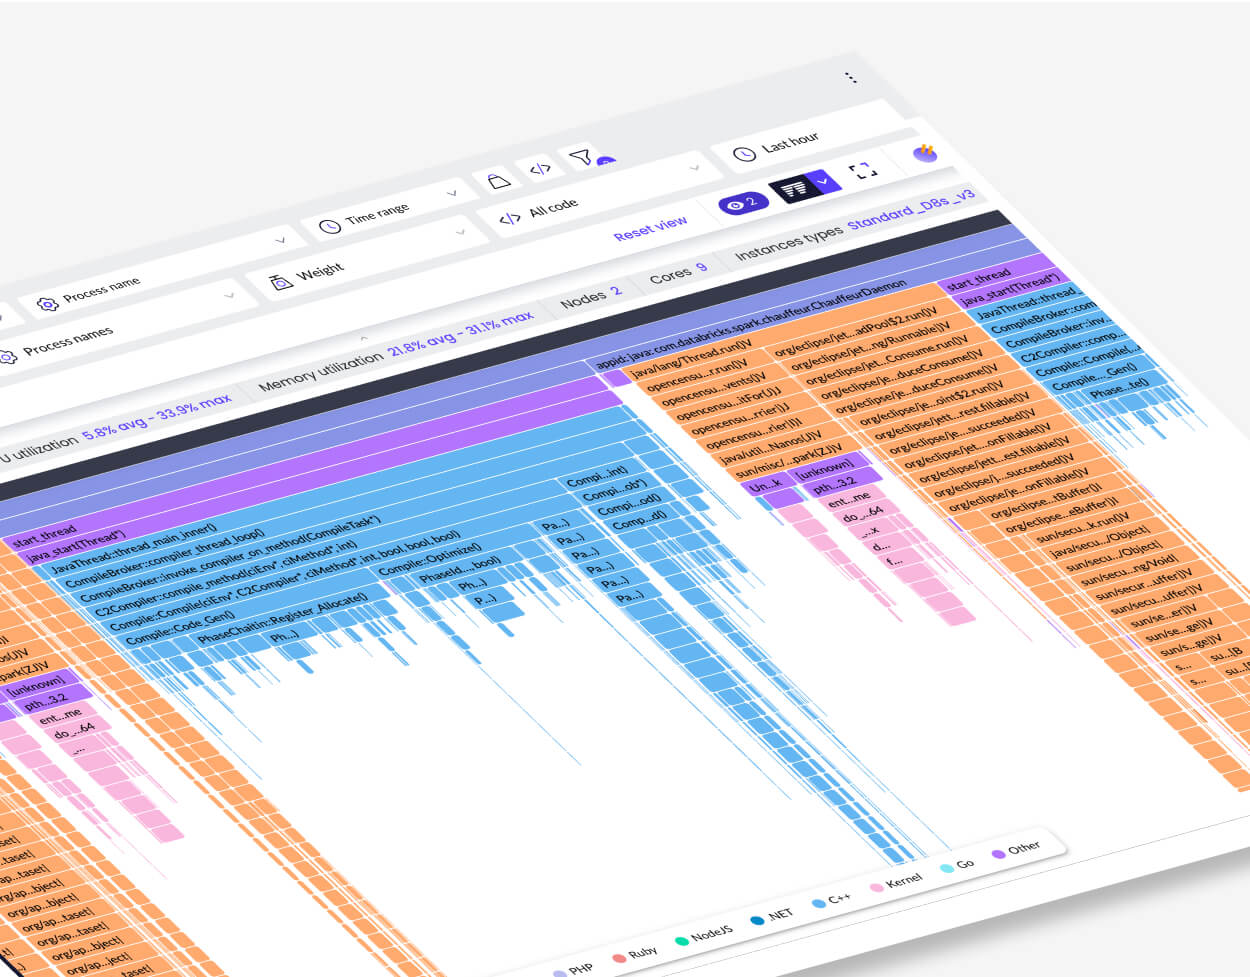
By continuously analyzing code performance across your entire environment, you can optimize the most resource-consuming parts of your code, improve application performance, and reduce costs.
Follow these instructions for deploying Continuous Profiling for Scala Applications, which can also be applied for Java in most cases.