


A Java Virtual Machine (JVM) consists of an abstract machine, or engine, that Java-based applications run on. It mainly provides a portable execution for the same program written in Java using a specific implementation for different operating systems, making it platform-independent. JVM also manages memory for Java applications by allocating/deallocating needed and unused memory.
In this post, we’ll cover the main concepts behind Java garbage collection (GC) and its impact on performance. In addition, we’ll provide some approaches to monitor, troubleshoot, and tune GC to improve the performance of Java applications.
Benefits of Garbage Collection
In a JVM, all Java applications’ data objects are stored in the Heap. The Garbage Collector (GC) is the automatic process that finds and removes unreferenced Java objects from the heap area—that is, it reclaims the runtime unused memory.
The key benefit of the GC is that Java programmers don’t need to explicitly write code to allocate and deallocate memory in Java applications, in contrast to other programming languages like C where managing memory is a manual process.
How Does Garbage Collection Work
Heap Generations
Most available GCs divide the heap into Young Generation, Old Generation, and Permanent Generation, as shown in Figure 1 below
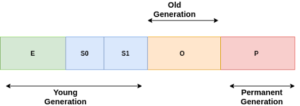
Figure 1: Default heap generations
All new objects are allocated to the Young Generation, which is divided into three spaces: Eden and two survivor spaces (S0 & S1). Objects that have survived a GC cycle are copied from the Eden space to one of the Survivor spaces. A Minor GC is the process of removing unused objects from the Young Generation.
All objects that survive multiple Minor GC rounds in the Young Generation are copied to the Old Generation space, where Major GC rounds remove unused objects from the Old Generation; this usually takes a longer time than a Minor GC.
Garbage First (G1), a GC algorithm we’ll explore below, has introduced a new layout of the heap by dividing it into fixed-size regions, with each region assigned to a specific heap’s generation. The size of the G1 regions can be specified using the VM option –XX-G1heapregionsize. The following figure shows the G1 heap structure:
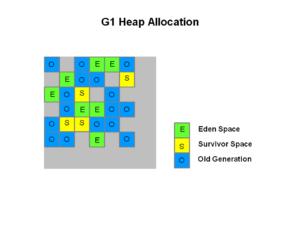
Figure 2: G1 heap structure (Source: Oracle)
Steps in the Generational Garbage Collection Process
During the lifecycle of the Garbage Collection process, there are three basic phases: Mark, Sweep, and Compact. These phases can trigger a Stop-the-World event.
- Mark: GC identifies all reachable objects (still alive) in the heap, starting from the so-called GC roots including local variables, active threads, static fields, and JNI references; it marks all visited objects (referenced by other objects) as “live” (in blue), as illustrated in the following figure:

Figure 3: GC Mark phase (Source: Plumbr.io)
- Sweep: GC scans the heap and removes dead objects after the Mark phase.
- Compact: GC gathers all live objects together in sequential order (to remove fragmentations in the heap), which makes allocating new objects faster and more efficient.
- Stop-the-World (STW): The GC stops the application’s threads to perform its work.
Java GC Algorithms and Their Use Cases
Serial Garbage Collector
This is the simplest garbage collector that works in a single-threaded fashion, where it has to stop the application to perform the garbage-collection steps. You can enable this via the option -XX:+UseSerialGC; it is typically used with client-style machines for embedded applications.
Parallel Garbage Collector
This method uses parallel threads to speed up GC work, although it still stops the application threads like serial GC. It is best suited for high-throughput-centric applications where long pauses are acceptable. It can be enabled using the -XX:+UseParallelGC command-line option.
Concurrent Mark Sweep (CMS) Garbage Collector
Here, most of the GC work is done concurrently with the application threads in an attempt to reduce GC pauses. It can be enabled via -XX:+UseParNewGC, although it has been deprecated in Java 9 and dropped completely in Java 14.
Garbage-First (G1) Garbage Collector
This is the modern version of the CMS collector and is designed for multiprocessor machines with large sizes of heap memory. It uses parallel threads and performs most of its tasks concurrently with the execution of the application. Even though it still needs a few STW pauses, it always seeks to not exceed the maximum pause-time target. Since Java 9, G1 has been the default GC and can also be explicitly enabled using -XX:+UseG1GC.
In summary, choosing the GC implementation that best fits your needs based on your application constraints and goals is an essential step in optimizing GC performance.
GC Performance Issues
As stated above, having GC as part of the JVM provides multiple benefits in terms of flexible and automated memory management for Java programs. However, this does come at a price in the form of performance impact and overhead related to resource-usage during the garbage collection process.
In some situations, the time spent on garbage collection may lead to heavy CPU usage, even more than the running application, leading to low throughput. Furthermore, long GC pauses or ongoing Stop-the-World events can dramatically decrease the responsiveness of your application, resulting in high latency.
Next, we’ll explore some tuning and monitoring techniques for you to identify and avoid performance and memory issues related to GC; this will help make garbage collection in your application as efficient as possible.
Performance Tuning and Analysis
JVM Parameters for GC
The following are the most common options that control the behavior of GC algorithms:
| Option | Description and considerations |
| -XX:MaxGCPauseMillis=<n> | Limits the maximum pause time and reclaims the heap space; default for this depends on the GC, e.g., default value for G1 is 200 |
| -XX:GCTimeRatio=<n> | Sets the target ratio of GC time to the application time 1/ (1+nnn); n= 9 sets the ratio of 0.1 of total time for GC work |
| -Xms=<m> &-Xmx=<m> | The (Xms)minimum and (Xmx)maximum heap size that your application can use; large heap size means longer GC pauses |
| -XX:ParallelGCThreads=<n> | Defines the number of threads to be used in parallel stages of GC |
| -XX:ConcGCThreads=<n> | Configures the number of threads that concurrent GC is allowed to use; increasing the number of concurrent threads will speed up GC work |
| -XX:InitiatingHeapOccupancyPercent=<n> | Specifies the percentage of the heap occupation to trigger concurrent GC cycle; has a default value of 45 |
In most cases, when running a small Java application, going with the default values should be more than fine.
GC Logs and Metrics
Understanding and analyzing GC logs is a key element in optimizing GC behavior. You can enable detailed logs using the options below:
Up to Java 8:
- -XX:+PrintGCDetails
- -XX:+PrintGCTimeStamps
- -XX:+PrintGCDateStamps
- -XX:+PrintTenuringDistribution
- -XX:+PrintGCApplicationStoppedTime
- -Xloggc:</path/to/gc.log>
For Java 9 and above:
- -Xlog:gc*:file=</path/to/gc.log>
Analyzing GC logs allows you to study GC performance metrics including:
- Time spent in GC, GC overhead
- Frequency of garbage collection
- Length of GC pause times
- Heap size
Below is an example of a portion of a GC log file for a simple Java 11 Spring Boot application (Java -XX:+UseG1GC -Xlog:gc*:file=/var/log/quicksilver/gc.log -Xmx50m -jar App.java):
[0.003s][info][gc,heap] Heap region size: 1M

[0.004s][info][gc     ] Using G1

[0.004s][info][gc,heap,coops] Heap address: 0x00000000fce00000, size: 50 MB, Compressed Oops mode: 32-bit

[0.004s][info][gc,cds       ] Mark closed archive regions in map: [0x00000000ffe00000, 0x00000000ffe6aff8]

[0.004s][info][gc,cds       ] Mark open archive regions in map: [0x00000000ffc00000, 0x00000000ffc46ff8]

[0.489s][info][gc,start     ] GC(0) Pause Young (Normal) (G1 Evacuation Pause)

[0.490s][info][gc,task      ] GC(0) Using 2 workers of 10 for evacuation

[0.499s][info][gc,phases    ] GC(0)   Pre Evacuate Collection Set: 0.0ms

[0.499s][info][gc,phases    ] GC(0)   Evacuate Collection Set: 8.9ms

[0.499s][info][gc,phases    ] GC(0)   Post Evacuate Collection Set: 0.3ms

[0.499s][info][gc,phases    ] GC(0)   Other: 0.2ms

[0.499s][info][gc,heap      ] GC(0) Eden regions: 23->0(17)

[0.499s][info][gc,heap      ] GC(0) Survivor regions: 0->3(3)

[0.499s][info][gc,heap      ] GC(0) Old regions: 2->7

[0.499s][info][gc,heap      ] GC(0) Humongous regions: 1->1

[0.499s][info][gc,metaspace ] GC(0) Metaspace: 3814K->3814K(1056768K)

[0.499s][info][gc           ] GC(0) Pause Young (Normal) (G1 Evacuation Pause) 24M->9M(50M) 9.470ms

[0.499s][info][gc,cpu       ] GC(0) User=0.03s Sys=0.00s Real=0.01s

[0.682s][info][gc,start     ] GC(1) Pause Young (Normal) (G1 Evacuation Pause)

[0.682s][info][gc,task      ] GC(1) Using 2 workers of 10 for evacuation

[0.692s][info][gc,phases    ] GC(1)   Pre Evacuate Collection Set: 0.0ms

[0.692s][info][gc,phases    ] GC(1)   Evacuate Collection Set: 9.8ms

[0.692s][info][gc,phases    ] GC(1)   Post Evacuate Collection Set: 0.6ms

[0.692s][info][gc,phases    ] GC(1)   Other: 0.1ms

[0.692s][info][gc,heap      ] GC(1) Eden regions: 17->0(17)

[0.692s][info][gc,heap      ] GC(1) Survivor regions: 3->2(3)

[0.692s][info][gc,heap      ] GC(1) Old regions: 7->10

[0.692s][info][gc,heap      ] GC(1) Humongous regions: 1->1

[0.692s][info][gc,metaspace ] GC(1) Metaspace: 6120K->6120K(1056768K)

[0.692s][info][gc           ] GC(1) Pause Young (Normal) (G1 Evacuation Pause) 26M->10M(50M) 10.559ms

[0.692s][info][gc,cpu       ] GC(1) User=0.04s Sys=0.00s Real=0.01s

[0.877s][info][gc,start     ] GC(2) Pause Young (Normal) (G1 Evacuation Pause)

[0.877s][info][gc,task      ] GC(2) Using 4 workers of 10 for evacuation

[0.886s][info][gc,phases    ] GC(2)   Pre Evacuate Collection Set: 0.0ms

[0.886s][info][gc,phases    ] GC(2)   Evacuate Collection Set: 8.4ms

[0.886s][info][gc,phases    ] GC(2)   Post Evacuate Collection Set: 0.5ms

[0.886s][info][gc,phases    ] GC(2)   Other: 0.3ms

[0.886s][info][gc,heap      ] GC(2) Eden regions: 17->0(19)

[0.886s][info][gc,heap      ] GC(2) Survivor regions: 2->2(3)

[0.886s][info][gc,heap      ] GC(2) Old regions: 10->10

[0.886s][info][gc,heap      ] GC(2) Humongous regions: 1->1

[0.886s][info][gc,metaspace ] GC(2) Metaspace: 8847K->8847K(1056768K)

[0.886s][info][gc           ] GC(2) Pause Young (Normal) (G1 Evacuation Pause) 27M->11M(50M) 9.185ms

[0.886s][info][gc,cpu       ] GC(2) User=0.03s Sys=0.00s Real=0.01s

[1.009s][info][gc,start     ] GC(3) Pause Young (Normal) (G1 Evacuation Pause)

[1.009s][info][gc,task      ] GC(3) Using 4 workers of 10 for evacuation

[1.013s][info][gc,phases    ] GC(3)   Pre Evacuate Collection Set: 0.0ms

[1.013s][info][gc,phases    ] GC(3)   Evacuate Collection Set: 3.3ms

[1.013s][info][gc,phases    ] GC(3)   Post Evacuate Collection Set: 0.6ms

[1.013s][info][gc,phases    ] GC(3)   Other: 0.1ms

[1.013s][info][gc,heap      ] GC(3) Eden regions: 19->0(19)

[1.013s][info][gc,heap      ] GC(3) Survivor regions: 2->2(3)

[1.013s][info][gc,heap      ] GC(3) Old regions: 10->11

[1.013s][info][gc,heap      ] GC(3) Humongous regions: 1->1

[1.013s][info][gc,metaspace ] GC(3) Metaspace:
Although analyzing and understanding GC logs isn’t easy because of the different JVM implementations and formats, it’s still worth it to start looking at them while evaluating the performance and memory usage of any JVM-based application. Luckily, there are free tools that help you analyze GC logs, such as Universal GC Log Analyzer:
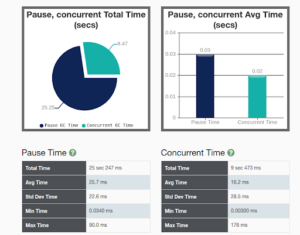
Figure 4: G1 GC pause times (Source: GCeasy report for the above GC logs)
The Unpredictability of GC
One of the most important points to understand about GC is that it is non-deterministic, meaning switching to different garbage collectors for your application does not always guarantee the desired performance results; the same applies to adjusting the GC JVM parameters.
GC-tuning requires effort and many experiments in order to observe the behavior of the garbage collector and your application and achieve potential improvements with every tuning change. Furthermore, trying to tune garbage collection at the application level is not recommended, as in most cases, it can lead to worse results; this approach requires deep knowledge and much practice to achieve the desired outcome.
Summary
Tuning GC is neither a straightforward nor a quick task. Every application has different memory-usage patterns, thus garbage collection will act differently in each case. In most scenarios, multiple iterations of GC-tuning are needed to acquire the proper benchmarks and achieve tangible performance improvements.