Deployment requires no code changes and a utilization penalty of less than 1%.
Continuous production profiling, made easy.


How it works
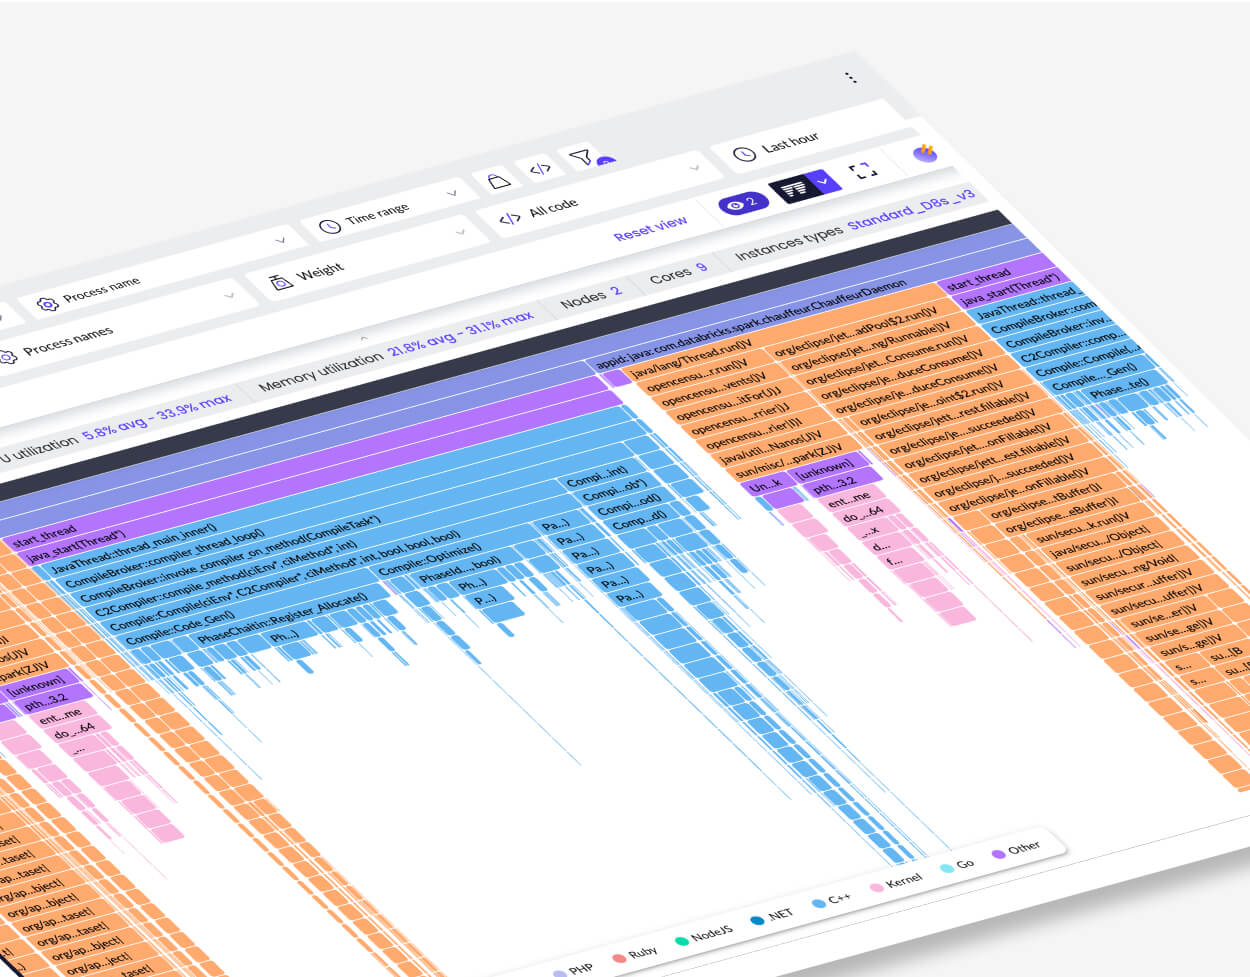
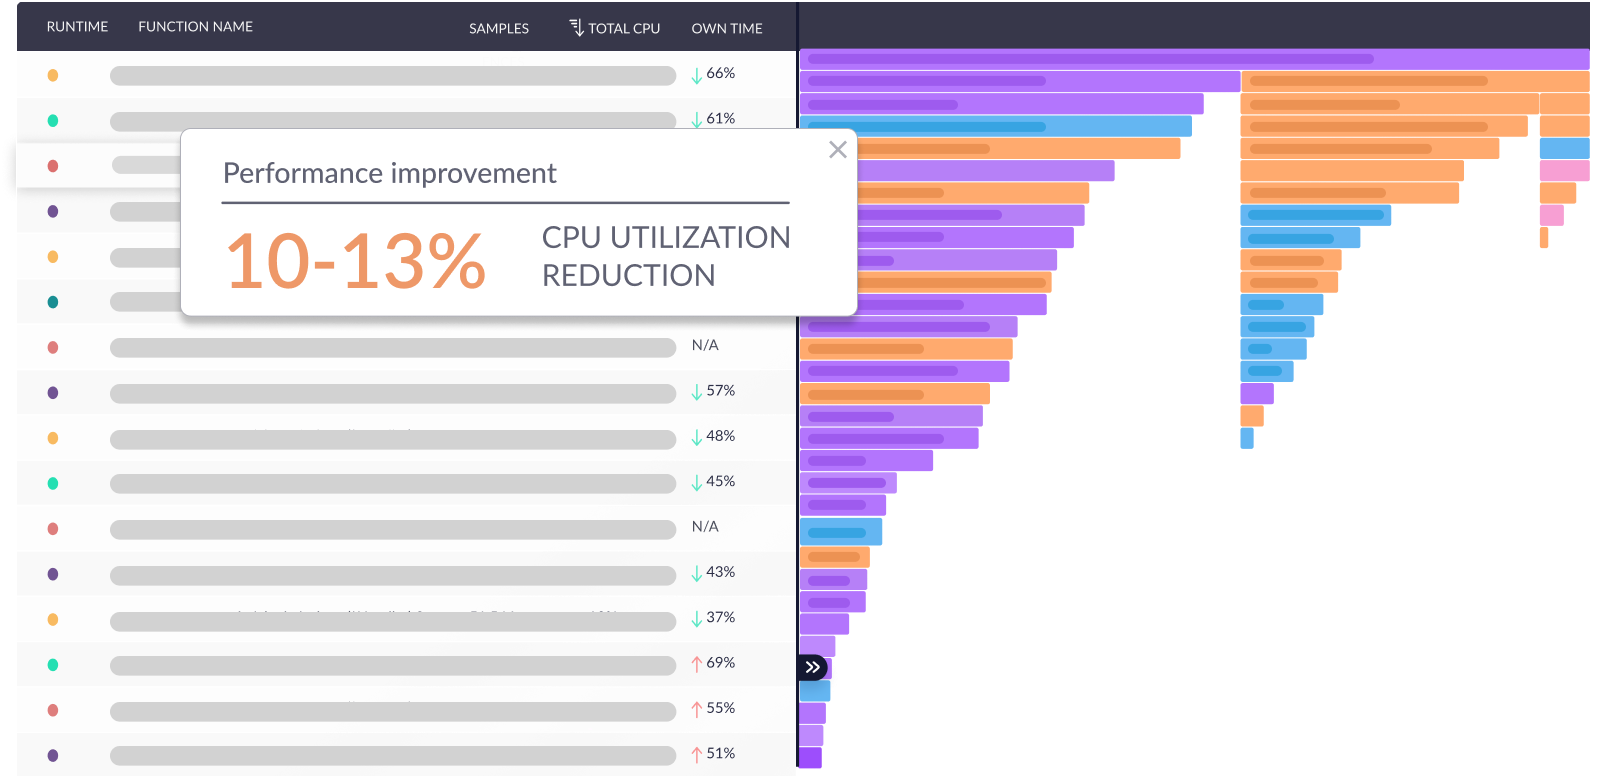
03.Visualize
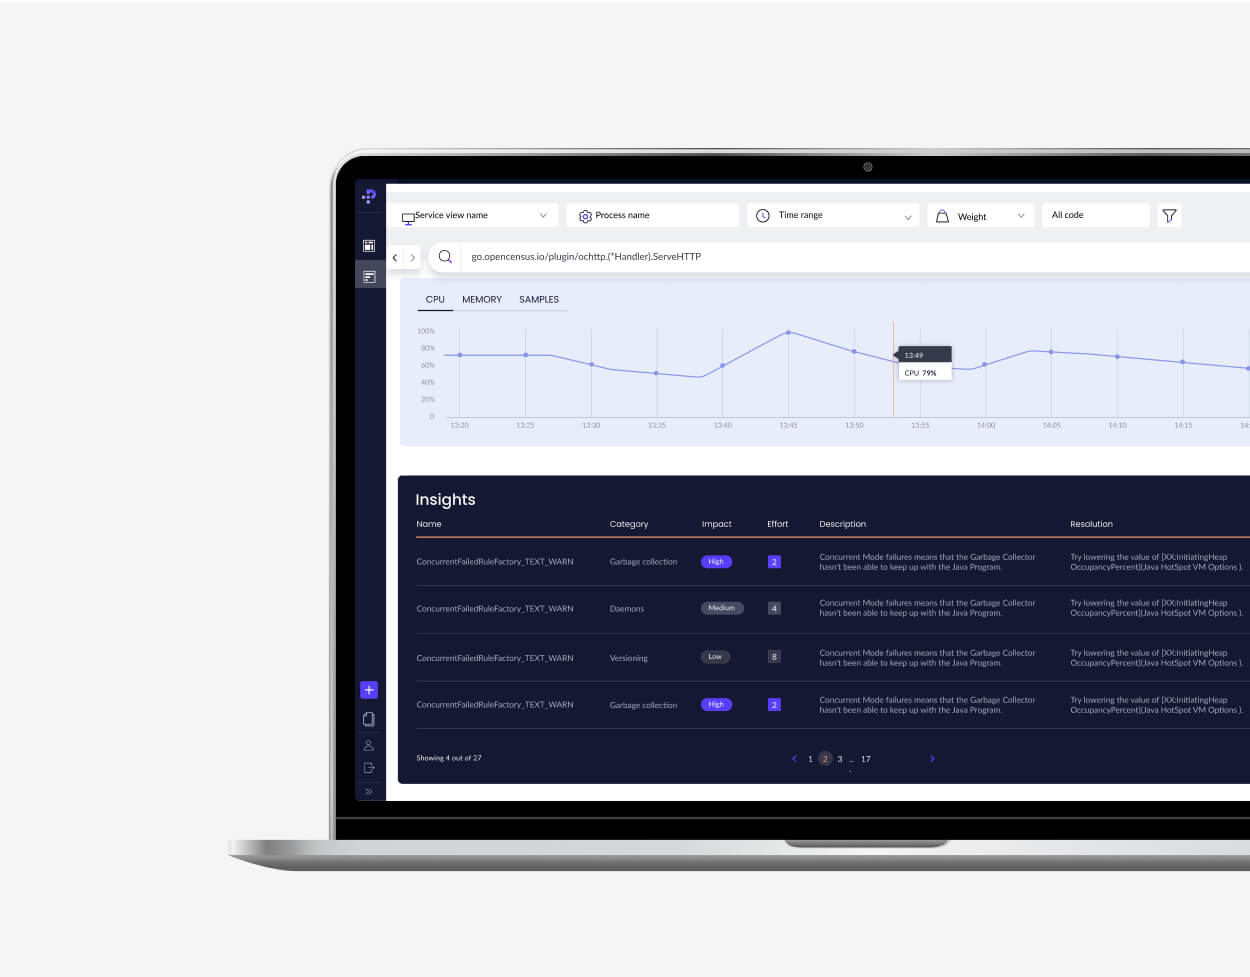
Benchmark and optimize
Gain complete visibility without SLA performance degradation
What is continuous profiling?
Discover optimization opportunities
Production profiling is a technique that enables the analysis of code-level performance to pinpoint bottlenecks and identify areas for optimization.

Improve performance to reduce costs
By continuously analyzing code performance across your entire environment, you can optimize the most resource-consuming parts of your code, improve application performance, and reduce costs.
Innovative enterprise technology
Major tech companies, including Google and Netflix, rely on production profiling to optimize their infrastructure, reduce costs and enhance performance

Interested in learning more?


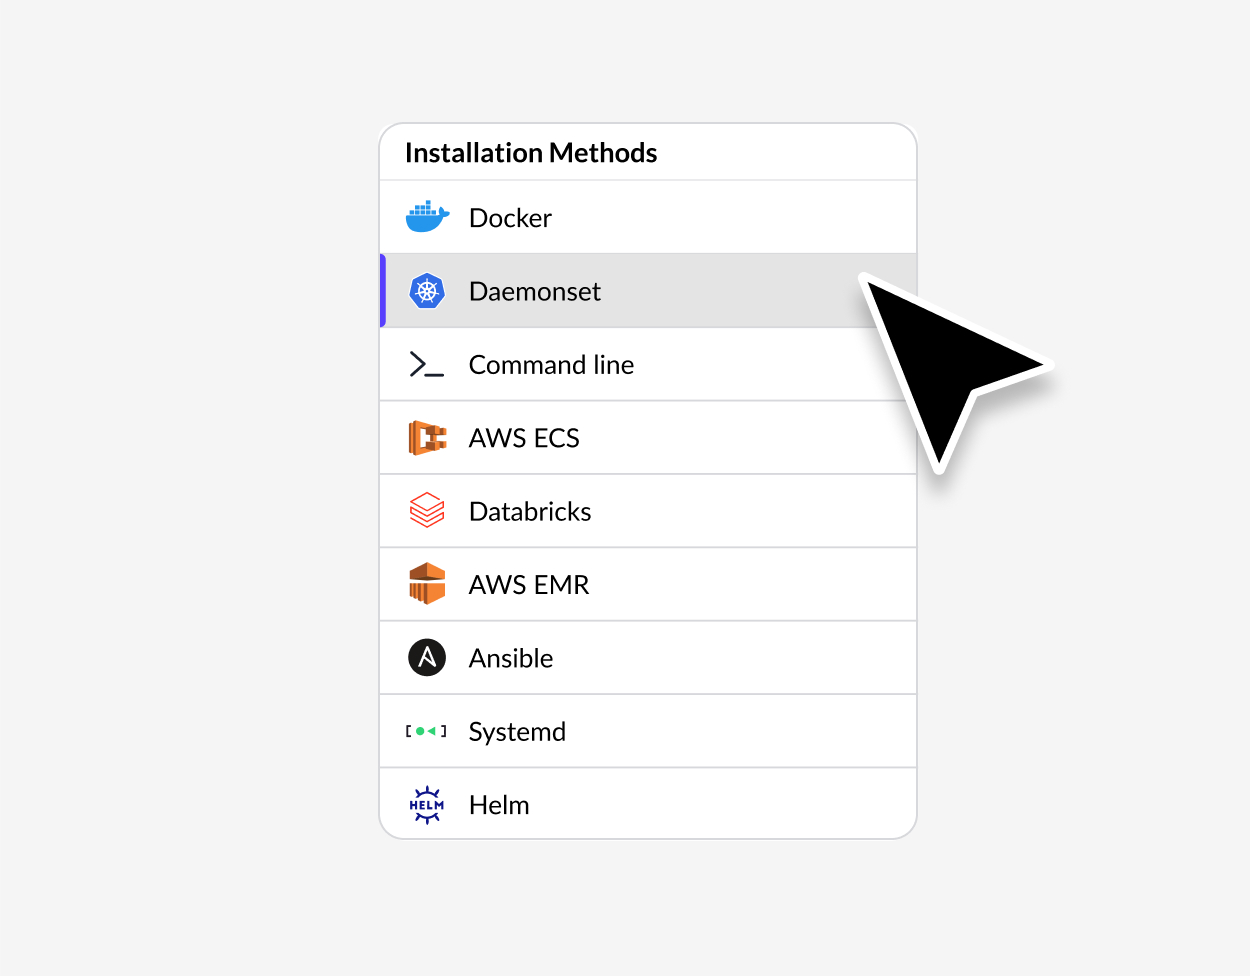
Easy Deployment
Deployed in minutes cluster wide, on distributed environments such as Kubernetes, Big Data and stream processing workloads, with no code changes required.
Flexible Integration
View any environment from a system-wide perspective with our comprehensive language support.
Inter Process Communication
Languages supported include: Clojure, Scala, C/C++, Ruby, Java, Python, JS, PHP, Go, and lots more.
Benefits of continuous profiling
Ensure Code Efficiency
Complete visibility without compromising
SLA performance
Light Weight
Low utilization penalty of less than 1% based on eBPF technology
Held to Intel's security standards