When we think of big data frameworks, we can’t help but think of Apache Spark—an open-source big data framework that provides the functionalities for large-scale data processing and analytics workloads. Spark has become the de-facto big data processing engine for both on-premises and in the cloud and provides the ability to process and analyze large volumes of data in a distributed fashion. Still, without the appropriate tuning, you can run into performance issues.
In this article, we first present Spark’s fundamentals, including its architecture, components, and execution mode, as well as APIs, the first thing you need to write efficient Spark applications. Then, we will explore different techniques and tools to help you boost the performance and efficiency of your Spark applications.
An Overview of Apache Spark
Apache Spark is an open-source engine for in-memory processing of big data at large-scale. It provides high-performance capabilities for processing workloads of both batch and streaming data, making it easy for developers to build sophisticated data pipelines and analytics applications. Spark has been widely used since its first release and has an active and strong community around the world.
In this section, we will cover Apache Spark’s main distributed components and its architecture, guide you through how your Spark application interacts with them, and show how the execution is decomposed into parallel tasks on a cluster.
Apache Spark Ecosystem
Apache Spark is a powerful framework that offers high-level APIs in different programming languages, including Java, Scala, Python, and R. Its underlying core engine provides functionalities for distributed, scalable, parallel, fault-tolerant, and in-memory computation; it also features additional built-in libraries including:
- SQL and DataFrames, which provide SQL-like queries in Spark applications for exploring large data sets that benefit from SQL’s optimized execution engine.
- Spark Streaming, which lets you develop stream processing jobs similar to batch processing.
- MLlib (machine learning) is a scalable machine library that comes with many popular algorithms (e.g., regression, clustering) and utilities (e.g., feature extraction) for Spark ML applications.
- GraphX (graph) allows you to process graph data at large-scale and delivers a set of common graph algorithms such as PageRank.
The following diagram shows the main components of the Spark ecosystem:
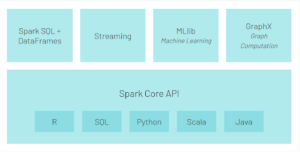
Figure 1: Apache Spark ecosystem (Source: databricks)
Furthermore, Spark supports and integrates with a wide variety of data sources including Hadoop HDFS, Apache Cassandra, Apache Kafka, Elastic, and more.
Apache Spark’s Architecture
Apache Spark is based on a master/slave architecture that runs on a cluster of nodes. The master node containing the Spark application acts as the driver program, which creates the SparkContext or SparkSession objects (main entry points for all Spark functionalities).
SparkContext allocates the required resources on the cluster by communicating with the cluster manager of the worker nodes, where executors run. Spark supports several cluster managers, including: standalone cluster managers, Kubernetes, Apache Hadoop YARN, and Apache Mesos. Finally, the driver program schedules and runs the computation tasks of the application across the executors throughout its lifetime. The following figure presents the general components of Spark’s distributed architecture:
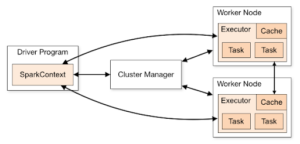
Figure 2: Overview of Spark architecture (Source: Spark)
Computational Model
Spark Core is a directed acyclic graph (DAG) execution engine that offers in-memory computation. Here, each Spark application is converted into a DAG that is executed in parallel by the core engine across multiple nodes of a cluster. The DAG is the logical execution plan of the stages and tasks of a Spark job.
Spark Application Key Concepts
The following is a list of the key components of Apache Spark and their responsibilities:
- Spark application: Here you have the source code program built using Spark APIs, which logically consists of the driver and executor processes on the cluster.
- Spark driver: This is the main process of the application and is responsible for creating the SparkContext that coordinates with the cluster manager to launch executors in a cluster and schedule work tasks on them.
- Cluster manager: The external (standalone, Kubernates, YARN, or Mesos) component that manages and facilitates the cluster resources for your Spark application is the cluster manager.
- Executors: These are the distributed processes on the worker nodes responsible for the concurrent execution of tasks assigned to them from the driver (number of executors ⇔ parallelism); each spark application gets its own set of executors.
- Task: This entails the actual computation units of the Spark application handled by the executors.
- Job: A Spark application consists of one or multiple jobs triggered by Spark actions, which run in parallel and are composed of multiple sages. Underneath, the driver converts each job to a DAG (i.e., execution plan); when all stages finish their work, the job is completed.
- Stage: The subdivided sets of tasks of the Spark job are called stages; each set executes a specific part of the code on different data partitions.
The following figure shows the conceptual relations between the driver, jobs, stages, and tasks of a Spark application:

Figure 3: Spark application execution hierarchy (Source: Learning Spark)
Spark Use Cases
Here are a few examples of the use cases where Spark can be used:
- Building end-to-end ETL (batch processing) pipelines for large data sets, e.g., log aggregation
- Implementing predictive analytics workloads, e.g., for telecommunication data
- Personalized customer recommendations in eCommerce platforms
- Processing massive amounts of streaming data from, e.g., financial systems
- Machine Learning applications
Spark’s APIs
For large datasets, there are several APIs that are easy to use. The basic data structures in Spark include Resilient Distributed Datasets (RDDs), low-level data abstractions that represent an immutable distributed in-memory collection of items. There are also Datasets, which are a high-level distributed collection of strongly-typed data objects; these leverage Spark SQL’s optimized execution engine. Finally, you have Dataframes; these are also distributed in nature (like RDDs) and represent a collection of rows under named columns.
In short, Spark supports two types of operations: Transformations, which are operations for transforming and manipulating data such as map, groupByKey, filter, and many more; and Actions, which are the operations for computing results, such as reduce, count, saveAsTextFile, and many more.
Application Example
The following code snippet shows a sample of a simple Spark application. It reads data from a CSV file, performs some filtration and aggregation on it, and then shows and writes the resulting aggregation to a JSON file. For simplicity’s sake, we use an interactive spark shell connected to a local standalone cluster, where a Spark session object is available as a “spark” variable:
# Get the input dataset filename

#Columns:(age,job,marital,education,default,balance,housing,loan,contact,day,month,# duration,campaign,pdays, previous,poutcome)

val inputFile = "bank.csv"


# Read the input CSV file into a Spark DataFrame

 val banksDataFrame = spark.read.format("csv")

 .option("delimiter", ";").option("header","true")

.option("inferSchema","true").load(inputFile)


# Filter records with aga > 20 and then group the records by job

val recordsByJobDataFrame = banksDataFrame.filter(col("age") > 20).groupBy("job")


# Aggregate mean of balance and counts  for each job

# OrderBy the total number of records in descending order

val aggregatedResultsDataFrame = recordsByJobDataFrame

.agg(mean("balance").alias("Balance mean"),

count(lit(1)).alias("Total")).orderBy(desc("Total"))


# Show the resulting aggregation for each job type.

# Given that show() us an action operation that will trigger the computation

aggregatedResultsDataFrame.show()


# Save the dataframe as JSON we use repartition(1) write out a    #single file

aggregatedResultsDataFrame.repartition(1)

.write.format("json").save("results")


 # Stop the SparkSession

 spark.stop()
The source data for the above code is available for download from UCI here.
Performance Optimizing and Tuning
Key Performance Metrics
The key metrics for troubleshooting performance issues with Spark applications include:
- Average time spent executing tasks and jobs
- Memory usage, including heap, off-heap, and executors/drivers
- CPU used by tasks vs. CPU used by Garbage collection (GC)
- Shuffle read/write, i.e., number of data records written and fetched to/from the disk in the shuffle operations
- Disk IO statistics
Optimization Techniques
There are various techniques to improve the performance and speed of your Spark application, which we will cover here below.
Apache Spark Configuration Tuning
Spark allows you to control each application setting and configuration using the Spark properties. Most properties have default values, but you can also set your own through SparkConf passed to the SparkContext/SparkSession, spark-submit, or spark-shell parameters; or, you can configure them in the conf/spark-defaults.conf.
It is important to understand how to configure the Spark application appropriately. Here, we’ll present the most common configurations that help you tune performance, focusing on the configurations of the resource allocation, memory management, and shuffle service:
| Property Name | Default Value | Recommendation and Description |
| spark.dynamicAllocation.enabled | false | Changing it to true allows your application to scale up/down the resources based on the workload; sub-properties are initialExecutors, minExecutors, and maxExecutors. |
| spark.executor.memory | 1g | The available memory per executor is divided into three divisions: execution, storage, and reserved. |
| spark.executor.cores | = number of all the cores available on the worker node | It controls the number of cores per executor and has to be balanced to avoid limiting the number of executors (large) or I/O overhead (low). |
| spark.shuffle.file.buffer | 32k | It specifies the size of the in-memory buffer of shuffle files; increasing to, e.g., 1 MB, will reduce disk I/O operations while writing the final shuffle files. |
| spark.default.parallelism | When using shuffle operations such as reduceByKey = number of partitions
When using operations such as parallelize = number of cores on all executor nodes |
This setting is based on the number of executors and their cores times two. |
| spark.serializer | org.apache.spark.serializer.
JavaSerializer |
It’s recommended to use org.apache.spark.serializer.KryoSerializer (Kryo serialization), which has better performance. |
Data Caching
There are many cases where you have large data being accessed repeatedly, which slows down your jobs. Here, it’s beneficial to use the cache and persist spark APIs to improve performance. The cache will store the data into the executor’s memory, whereas the persist allows you to control how the data is stored (as serialized or objects) and where (in memory or disk). For instance, persist (StorageLevel.MEMORY_AND_DISK) will store the data as objects in memory as much as allowed, and the rest will be stored as objects to the disk. Depending on your application, proper data caching will result in significantly better performance because it gives faster access to the frequent data sets.
Minimizing Shuffling
Shuffling data across partitions is a costly operation, as it requests writing the data to a disk and sending it over the network across the cluster; an unbalanced amount of shuffling in a Spark application may lead to some performance bottlenecks.
Shuffle operations include groupBy/aggregateByKey/reduceByKey, join, and distinct. Knowing the semantics of Spark transformations allows you to avoid unnecessary shuffling in your application, which results in better scalability and performance of the application jobs. Also, it is always valuable to monitor the shuffling service through, e.g., the Spark UI and look for opportunities to reduce the shuffling overhead as much as possible.
Garbage Collection (GC)
Since Spark runs on Java Virtual Machine (JVM), and its engine stores a large amount of data in memory, the GC overhead can affect the overall performance of your Spark application. So, it’s important to optimize the used data structures to have fewer objects and avoid creating temporary objects. Furthermore, it’s possible to make Spark store data off-heap using the “spark.memory.offHeap.enabled’‘ and “spark.memory.offHeap.size” configurations.
Luckily, the Spark UI helps identify the executors with GC overhead (10% of CPU time performing garbage collection) and provides a GC Time metric for all components of your Spark application. For more details and in-depth knowledge about tuning GC for Spark applications, check out this link.
Data Skew (Unevenly Distributed Partitions)
This is a pure data-related issue, where the source of data of your Spark application is unevenly grouped (data skew). This causes some unbalanced work distribution across executors, where some tasks process a larger amount of data than others. If you find the partitions are uneven, you can use the repartition (numPartitions) function to rebalance the partitions of your input data before processing them. However, the data skew problem is more likely to appear with join and aggregation operations because the records of a certain key will be in a single partition, which may cause some large partitions based on the underlying data. A common technique to overcome data skew is salting, i.e., adding random values to the records keys (key + random_salt), which improves the distribution of the partitions.
Spark Web UI Inspections & Monitoring
Spark UI provides a rich set of information on jobs, stages, memory usage, storage, SQL metrics, and logs for your Spark application. It can be accessed on the Spark driver node using [http://spark-driver-host:4040/].
The Spark UI mainly offers the following insights that can help you understand the performance of your application:
- Aggregated metrics of executors, such as completed tasks and memory and disk usage, as shown in the figure below:
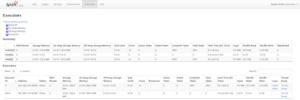
Figure 4: Executer metrics (Source: Spark UI on local machine)
- Stages of all jobs:
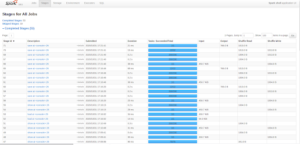
Figure 5: Stages of all jobs (Source: Spark UI on local machine)
- The DAG for each job; for example, here is a DAG visualization for a job in our sample application above:
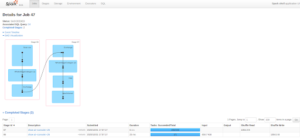
Figure 6: Example of DAG (Source: Spark UI on local machine)
- An event timeline that displays the application events as well as executor allocation and deallocation
- Details on memory and storage usage
- Environment, that is, runtime information, property settings, library paths
- Information about Spark SQL jobs
Spark Metrics System
Spark components, including master, application, worker, executer, driver, and shuffle service, can be instrumented using Spark’s internal metrics system, which is based on the Dropwizard Metrics Library. This lets you export the collected metrics to various sinks, e.g., GraphiteSink (sends metrics to a Graphite node). For instance, the type of measurements for the shuffle service which will be reported to the metrics sink as follows:
- blockTransferRateBytes (meter)
- numActiveConnections.count
- numRegisteredConnections.count
- numCaughtExceptions.count
- openBlockRequestLatencyMillis (histogram)
- registerExecutorRequestLatencyMillis (histogram)
- registeredExecutorsSize
- shuffle-server.usedDirectMemory
- shuffle-server.usedHeapMemory
Conclusion
Apache Spark is a powerful framework for large-scale data processing with tremendous capabilities to scale; it also comes with a rich set of functionalities that help you build effective applications. Still, a poor understanding of Spark internals and configurations may lead to some performance issues in certain cases, which can be avoided.
In this article, we provided an overview of the Spark components and architecture along with recommended techniques to help improve the performance of your Spark applications; we also discussed tools to allow you to proactively identify the sources of possible performance bottlenecks.
