Due to increased market demand, modern development has increased the speed of production deployment. And because of hyper-automation, this enhanced speed is now achievable.
In software development, the application performance monitoring process informs us if there are any difficulties with the IT infrastructure or if there is any network intrusion. In addition, any issue with the application’s performance is also highlighted. In contrast, monitoring does not address minute code-level performance problems. Hence, the hyper-automated process of continuous performance profiling is essential.
Profiling identifies the piece of code that is creating problems, the duration of a certain job, the frequency with which a line of code is being called, its source, and time spent on executing the code at any one moment. This article will illustrate the concept of continuous profiling and showcase different tools to execute it for Python-based applications.
What is Continuous Profiling?
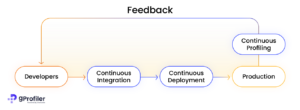
Continuous profiling includes the continuous aggregation of specific line-level performance data from a real-world production environment. This enables developers and operations teams to analyze the application’s performance speedily and fix any underperforming parts of the code.
Figure 1: Source
Benefits of Continuous Profiling
Why exactly do we need continuous profiling?
With a continuous profiling system in place, developers can gain insight into each line of code’s performance or the code’s use of restricted resources of interest—CPU time, wall clock time, memory, and disc I/O—that, when depleted, cause the system to choke. As a result, you can enhance scalability, decrease expenses, boost reliability, and speed up recovery from performance regressions by identifying and optimizing the sections of your software that use these resources.
It helps us profile the performance of new features
As soon as a new feature is launched, continuous profiling is an excellent means of determining where resources, such as CPU and memory, are being used the most by a component, function, or line of code. This enables developers to comprehend the profiled application’s runtime behavior and give practical recommendations for performance enhancements.
It enables us to better understand CPU usage to control excessive billing
The ability to quickly compare performance across versions reduces the effort necessary to identify even minor declines in performance concerning CPU utilization, making continuous performance improvement much more feasible. The combination of these factors can result in considerable savings in server resource use. Given the payment model of the cloud, which is becoming more and more popular, this immediately translates to lower operating expenses.
It can help us discover memory leaks
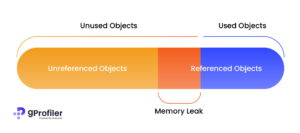
Memory profiler is a process in continuous profiling. This assists in the identification of memory leaks and memory churns, which cause stuttering, freezing, and unexpected app crashes. The app’s memory use is depicted graphically, and users can capture heap dumps, force garbage collection, and track the allocation of memory. This helps uncover places of potential memory leaks and subsequently plug those gaps in the code.
Figure 2: Source
It identifies and optimizes locations in the code where conflicts occur
Continuously lowering and eliminating performance bottlenecks can help improve the system’s overall scalability in response to demand growth or fluctuations. As bottlenecks can become the source of production issues as demand grows, removing them improves system dependability.
It helps us debug issues that occur during production
When a fresh deployment is sent to production, your metrics suddenly show that you are failing to meet all your performance goals. So what are you going to do?
Assuming a clean rollback is feasible, the typical reaction is to quickly roll back the deployment to a prior deployed version that you know to be good. The investigation then proceeds to attempt replicating the issue in a pre-production setting and determine the reason through profiling. This is frequently time-consuming, and there are many delicate characteristics of production (both load and the environment itself) that are difficult to replicate in a pre-production setting. While this inquiry is ongoing, deployment to the product is frequently halted, resulting in stakeholder frustration.
Continuous profiling compares performance data from the present underperforming system to previous data to quickly determine the reason for the performance decline.
It helps us uncover the root cause of latency
Python has many modules and built-in functions that may be used for either macro or micro profiling. For example, a line profiler may be used for micro-profiling, and cProfile or a time package can be used for macro-profiling. When we utilize the time package, the derived time may be incorrect owing to a delay induced by network latency or a busy CPU. As a result, timeit functions run the code several times and display the average time it took to perform.
Implementing Continuous Profiling
Implementing continuous profiling necessitates:
- A low-cost, production-safe sample profiler for your preferred language and runtime.
- A technique or database for saving data from your profilers.
- A method of producing reports based on said data.
None of these steps are in any way simple. It can be difficult to find low-overhead sample profilers appropriate for production. Moreover, for a system to be helpful, you may need to deal with and handle a large volume of profiling data. Many big corporations have made considerable efforts in adopting continuous profiling.
gProfiler
gProfiler offers real-time visibility into production settings and assists teams in identifying performance bottlenecks that cause performance deterioration and cost inflation. Most resource-consuming lines of code may be improved by employing continuous code performance profiling across the production environment. As a result, application performance increases, and expenses reduce considerably.
Characteristics
- Open-source software
- Fast installation: It can be installed on AWS, GCP, and Azure with a single command utilizing a container image or a public image.
- Continuous visualization of performance: It profiles all production code down to the line of code continuously.
- Support for distributed workloads (Kubernetes and Spark)
- Supports system-wide profiling including kernels and all processes
- Extremely low CPU use in production (1 percent)
- Native support for Java, Go, Python, Scala, Kotlin, and more languages.
Installation
gProfiler can be installed with a single standard command line that does not require any modification. Deploy the profiler with a single command line and begin profiling in less than 5 minutes. Alternatively, use their public image on AWS, Azure, and GCP, or a Docker container image from the Docker registry.
Docker installation: Run the following command on each node in the service you would like to run continuously.
docker pull granulate/gprofiler:latest
docker run –name gprofiler –restart=always -d –pid=host –userns=host -v /var/run/docker.sock:/var/run/docker.sock -v /lib/modules:/lib/modules:ro -v /usr/src:/usr/src:ro –privileged granulate/gprofiler:latest -cu –token <unique_api_key> –service-name “Service name”
How to Use gProfiler
gProfiler integrates various sample profilers to create a single view of what your CPU is doing, presenting stack traces of your processes spanning native programs, Java and Python runtimes, and kernel functions.
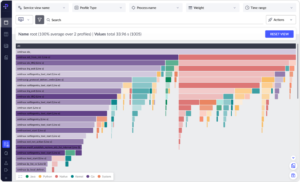
gProfiler may submit its data to the Granulate Performance Studio, which combines the results from various instances across different time periods and provides you with a comprehensive picture of what is going on throughout your cluster. To post results, you must first register on the website and generate a token.
Figure 3: profiler.granulate.io
Choosing a Profiling Tool
Traditional profiling tools or approaches can be resource-intensive and have a large overhead, making them only useful for limited periods. This means that the additional load of profiling must be kept to a minimum, allowing developers to efficiently detect and address performance bottlenecks as they emerge in production situations. This enables the user to maintain continuous visibility of application performance.
Another factor that discouraged many developers from adopting code profiling in the past was the time and effort required to set up conventional profilers. The installation required changes to the source code.
The Profiling Paradigm
Some might think a paradigm shift is required in the approach to profiling and monitoring. We want profiling to be done in a systematic, not haphazard, manner. That means doing it constantly on your system and not having to do things like hookup tooling when there’s an issue or a one-time occurrence that has to be resolved—being proactive rather than reactive in these matters and putting systems in place to analyze and handle these difficulties. In other words, please perform production profiling regularly.


