
What Is Elasticsearch?
Elasticsearch is a powerful, open-source search and analytics engine. It allows you to store, search, and analyze massive volumes of data quickly and in real time. It was designed to handle the challenges of today’s big data environments.
Elasticsearch is known for its speed, scalability, and ability to run complex searches against large data stores. It’s built on Apache Lucene, a high-performance, open source text search engine. Elasticsearch extends Lucene and makes it easier to work with by providing a simple RESTful API, distributed search capabilities, and other features.

One of the main benefits of Elasticsearch is its versatility. It can be used for a wide range of applications, from full-text search and analytics to log and event data management. It’s also highly customizable, enabling you to fine-tune its behavior to fit your specific needs.
In this article:
Elasticsearch Core Features
Before we start the tutorial, let’s review the key capabilities of Elasticsearch.
Full-Text Search Capabilities
Full-text search is a technique for searching a document or a collection of documents that store textual content. Elasticsearch allows users to perform and combine many types of searches — structured, unstructured, based on geography, or specific metrics.
Full-text search in Elasticsearch goes beyond simple text matching. It supports complex queries that take into account how close terms are in a document, the popularity of terms, the relevance of terms, and more. Elasticsearch also has robust multi-language support, allowing it to handle languages with unique requirements like English, Arabic, and Chinese.
Real-Time Indexing
While traditional databases must undergo a time-consuming process to update their indices, Elasticsearch updates its index with every data change, keeping it fresh and ensuring that you’re always working with the most up-to-date information. Elasticsearch is able to carry out real-time indexing without impacting query performance.
Distributed and Scalable Nature
As a distributed system, Elasticsearch can scale horizontally to handle large amounts of data while maintaining high performance.
Elasticsearch achieves its scalability by automatically partitioning data across multiple nodes, or servers, in a cluster. This process, known as sharding, allows Elasticsearch to distribute data and workload across multiple servers, ensuring that no single node becomes a bottleneck. In addition to sharding, Elasticsearch replicates data, creating copies of the data shards. This ensures that in case of a node failure, your data is still accessible from another node.

Data Analytics
Elasticsearch is not just a search engine; it’s also a powerful analytics tool. Using Elasticsearch, you can perform complex aggregations that allow you to extract and process your data in many ways.
Elasticsearch’s makes it possible to execute complex queries in near real-time. This means you can analyze large volumes of data and get immediate insights, a feature that’s invaluable in use cases like security analysis, performance monitoring, and business intelligence.
Elasticsearch also integrates with visualization tools like Kibana, making it easy to create interactive dashboards that help you visualize and understand your data.
Learn more in our detailed guide to Elasticsearch monitoring (coming soon)
RESTful API and Various Client Libraries
Elasticsearch offers a RESTful API and various client libraries that make it easy to interact with the search engine. The RESTful API provides a simple, stateless interface to the system, allowing developers to perform operations like searching and indexing data using standard HTTP methods.
In addition, Elasticsearch provides client libraries in various languages, including Java, Python, Ruby, and more. These libraries abstract the complexities of dealing with raw HTTP requests and responses and make it easier to interact with Elasticsearch programmatically.
Elasticsearch Tutorial: Getting Started With Elasticsearch
Step 1: Set Up Elastic Cloud
The first step is to create an Elastic Cloud account and create a deployment:
- Sign up for a free trial account.
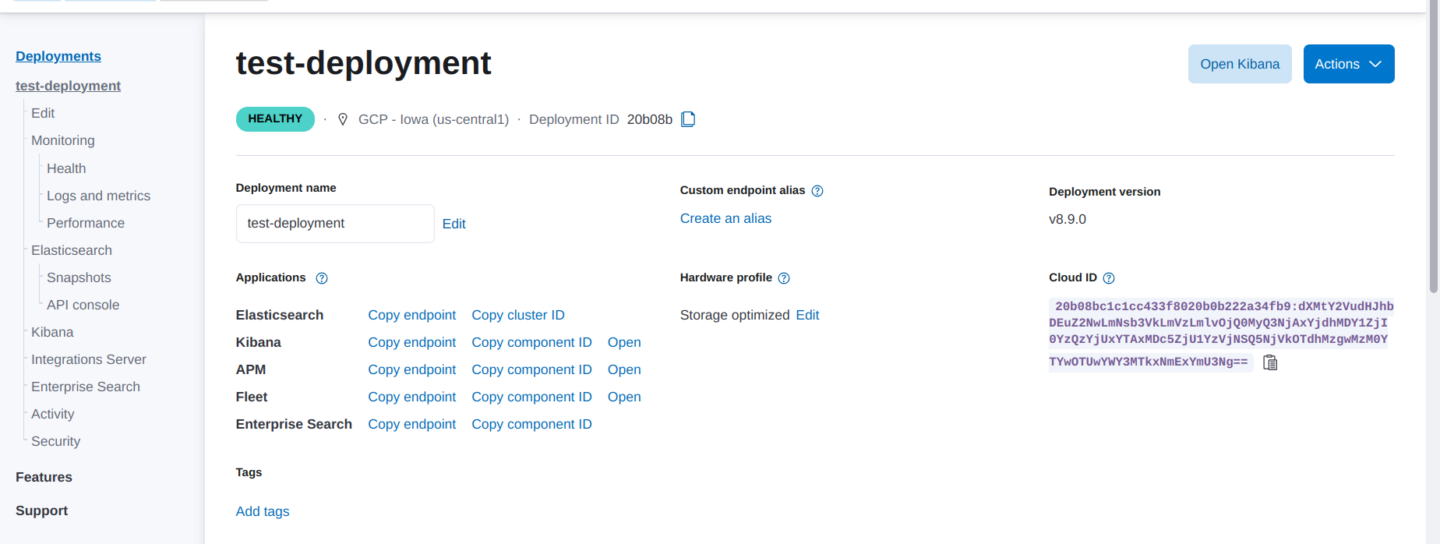
- After logging in, click Create a deployment. Select a unique name for your deployment and click on Create deployment.
- Wait for the deployment to finish and click Continue.
Step 2: Ingest Documents into Elasticsearch
You can ingest data into Elasticsearch by transmitting JSON objects, also known as documents, via the HTTP protocol. One way to ingest data is using the Kibana Dev Tools console to submit REST requests to Elasticsearch. Here is how to do it:
- Select I’d like to do something else to visit the Kibana website.
- From the Elastic main menu, select Dev Tools > Console.
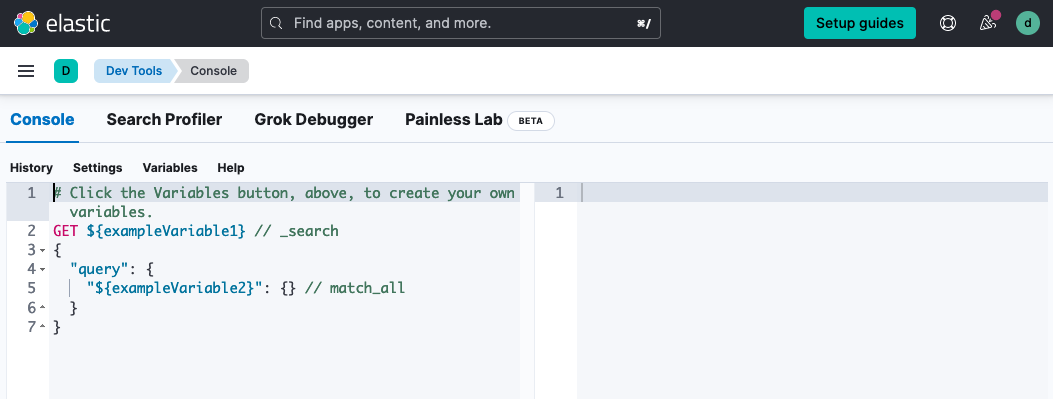
Source: Elastic
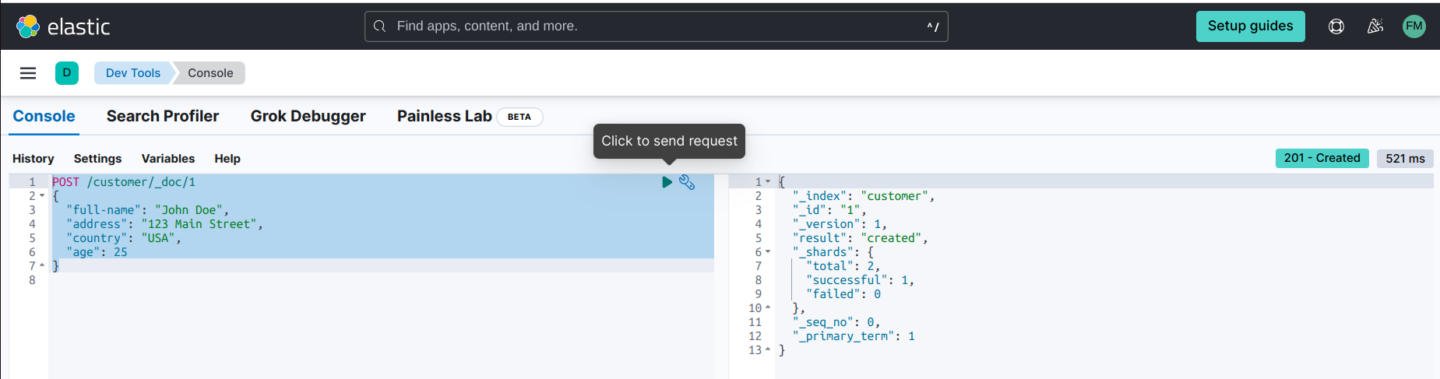
3. Submit an HTTP POST request with a JSON document:
POST /customer/_doc/1
{
  "full-name": "John Doe",
  "address": "123 Main Street",
  "country": "USA",
  "age": 25
}
Executing this request automatically creates a customer index, adds a new document designated with an ID of 1, and stores and indexes of the full-name field.
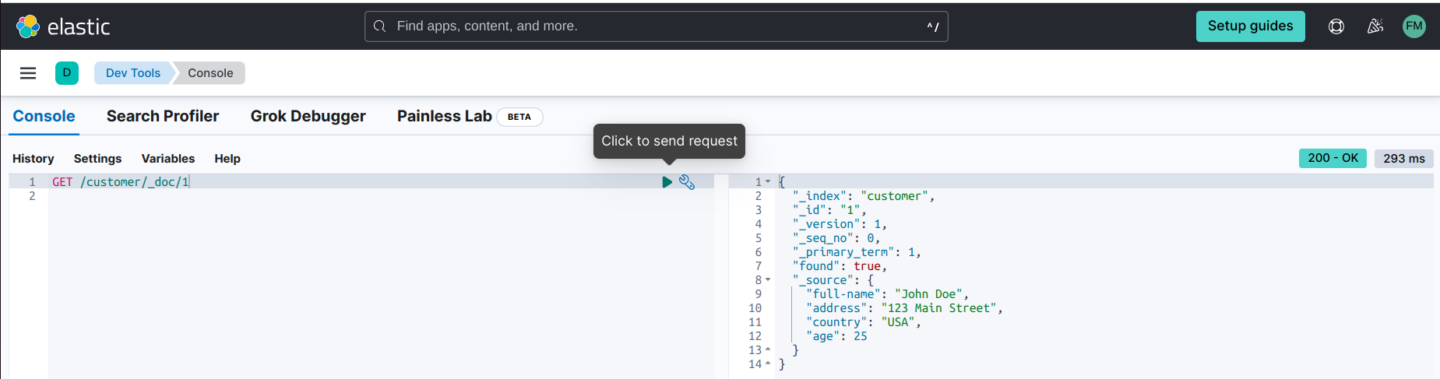
4. The newly added document is immediately reachable from any node in the cluster. You can use this GET request to retrieve it:
GET /customer/_doc/1
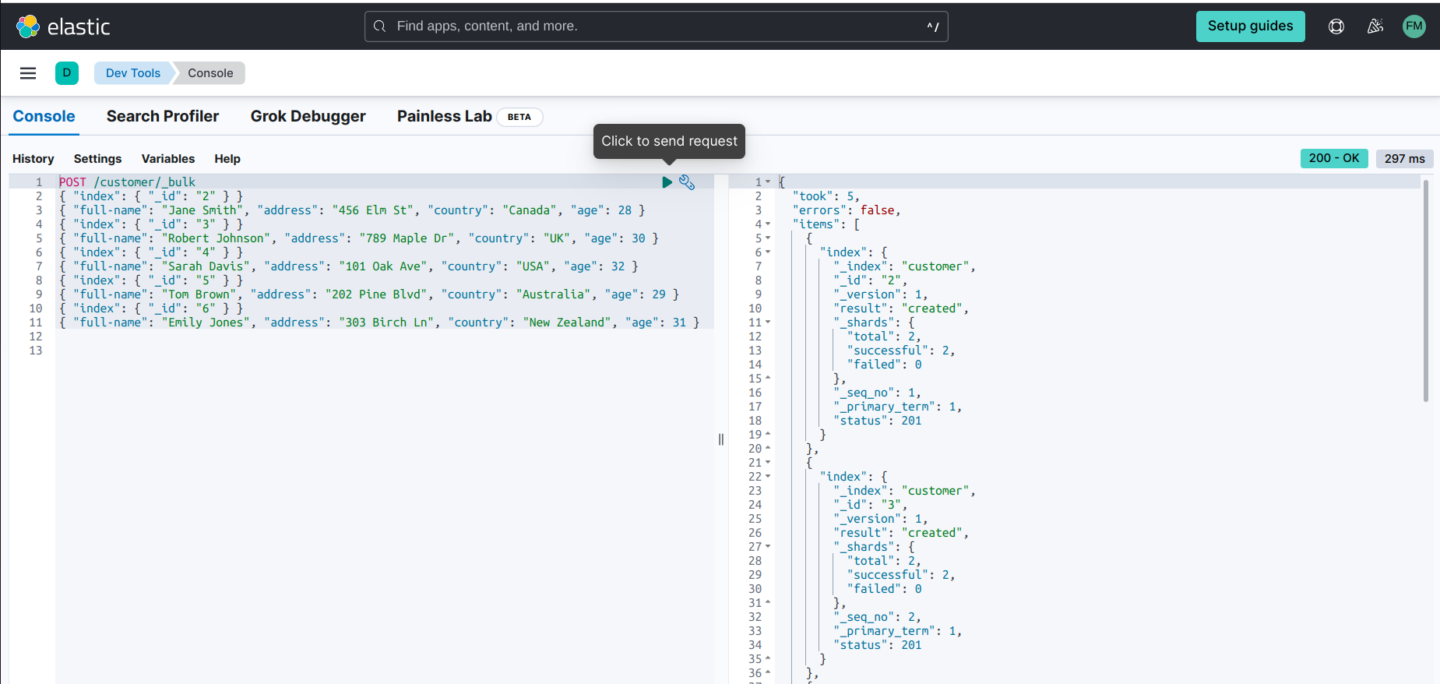
5. Now, let’s use the _bulk endpoint to ingest multiple documents to Elasticsearch in a single request, which is faster and more efficient than submitting them one by one. The following code lets you append five documents to the existing customer index:
POST /customer/_bulk
{ "index": { "_id": "2" } }
{ "full-name": "Jane Smith", "address": "456 Elm St", "country": "Canada", "age": 28 }
{ "index": { "_id": "3" } }
{ "full-name": "Robert Johnson", "address": "789 Maple Dr", "country": "UK", "age": 30 }
{ "index": { "_id": "4" } }
{ "full-name": "Sarah Davis", "address": "101 Oak Ave", "country": "USA", "age": 32 }
{ "index": { "_id": "5" } }
{ "full-name": "Tom Brown", "address": "202 Pine Blvd", "country": "Australia", "age": 29 }
{ "index": { "_id": "6" } }
{ "full-name": "Emily Jones", "address": "303 Birch Ln", "country": "New Zealand", "age": 31 }
Step 3: Querying Your Documents
Documents included in the index can be queried immediately after being posted. If you need to find specific terms contained in a field, a match query can be useful.
The following code retrieves customers whose addresses contain a specific street name:
GET /customer/_search
{
  "query": {
    "match": {
      "address": "Main Street"
    }
  }
}

Here is a more advanced query that combines multiple search criteria. This query retrieves documents for customers who are under the age of 40, and reside in the USA.
GET /customer/_search
{
  "query": {
    "bool": {
      "must": [
        { "term": { "country": "USA" } },
        { "range": { "age": { "lt": 40 } } }
      ]
    }
  }
}

Step 4: Visualize Data with Kibana
The first step is to create the ElasticSearch data view. We’ll use the following data to create the visualization in Kibana:
POST /customer/_bulk
{ "index": { "_id": "2" } }
{ "full-name": "Jane Smith", "address": "456 Elm St", "country": "Canada", "age": 28, "total_purchases: ($)" : 15000 }
{ "index": { "_id": "3" } }
{ "full-name": "Robert Johnson", "address": "789 Maple Dr", "country": "UK", "age": 30, "total_purchases: ($)" : 5000 }
{ "index": { "_id": "4" } }
{ "full-name": "Sarah Davis", "address": "101 Oak Ave", "country": "USA", "age": 32, "total_purchases: ($)" : 1000 }
{ "index": { "_id": "5" } }
{ "full-name": "Tom Brown", "address": "202 Pine Blvd", "country": "Australia", "age": 29, "total_purchases: ($)" : 1658 }
{ "index": { "_id": "6" } }
{ "full-name": "Emily Jones", "address": "303 Birch Ln", "country": "New Zealand", "age": 31, "total_purchases: ($)" : 9000 }
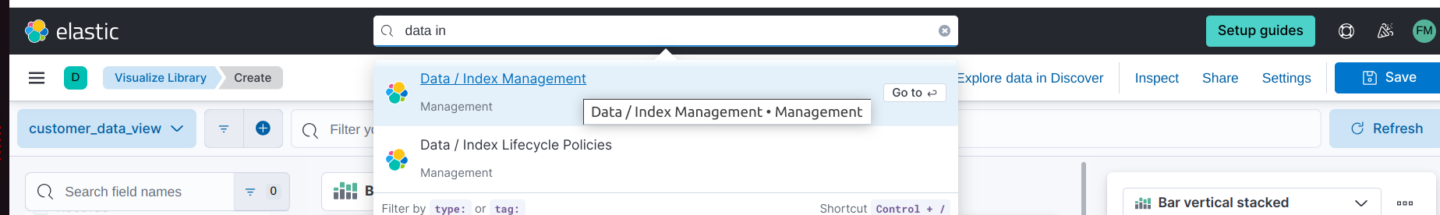
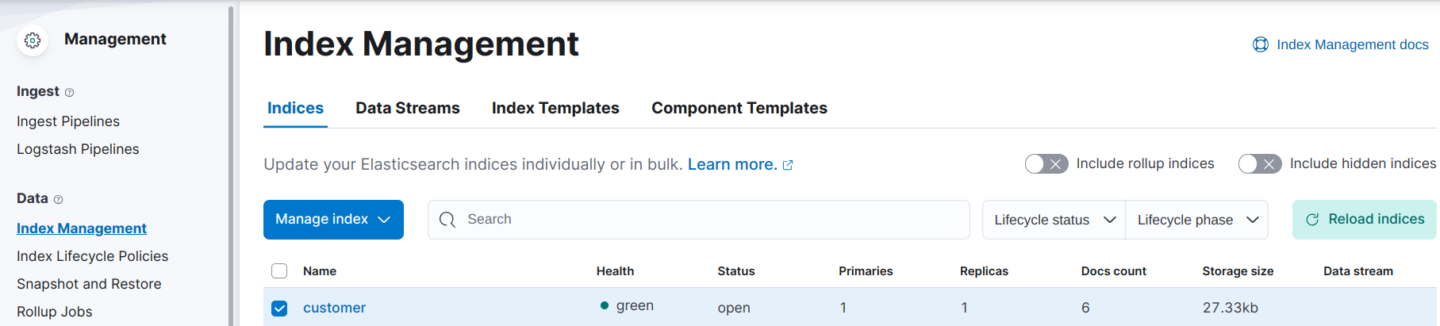
Next, select Data Index Management:
Ensure the Customer data index is available.
Kibana lets you create visualizations and interactive dashboards based on your Elasticsearch data. Here is how to create a simple Kibana dashboard:
- From the primary Kibana menu, select Dashboard.
- Select Create a Dashboard > Create visualization.
- Design your visualization by dragging and dropping fields, then hit Save and return.
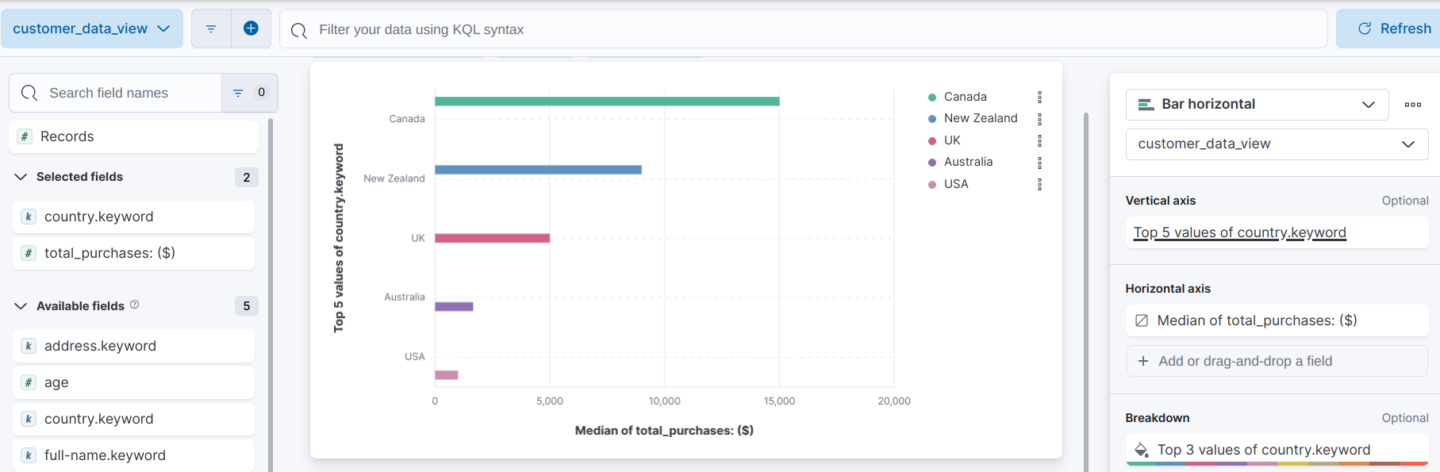
For example, in a customers database with addresses and details of purchases, here is how to create a bar chart showing the number of purchases per customer in different countries:
- Choose Bar chart from the list of visualization types.
- Under Data Source, select the index containing your customer data.
- For the X-axis, select Total Purchases and select the field representing countries.
- For the Y-axis, choose Country to represent the number of purchases.
- Drag and drop the country field into the X-axis bucket, and the purchase count into the Y-axis bucket.
- Give your visualization a title and save.
- Return to the dashboard and add your newly created visualization to it.
Learn more in our detailed guide to:
Elasticsearch on docker
Elasticsearch Vs Mongodb
Elasticsearch best practices (coming soon)