More often than not, developers need to investigate performance bottlenecks in their production applications and attempt to identify the root cause of the issue. A modern approach is to use profiling techniques and tools that highlight the slowest application code, that is, the area consuming most of your resources, such as CPU and memory. Continuous profiling is the process of collecting application performance data in a production environment and making that data available to developers for deeper analysis.
In this blog post, we will provide an overview of the application code profiling concepts and benefits. We will then list the top profiling tools and provide some considerations to choose one based on your use cases and needs. Finally, we will look at a common profiling data visualization (flame graphs) and discuss how to analyze profiling data for performance insights and perform actionable improvements.
Disclaimer– To give back to the community and accelerate industry awareness of computing inefficiencies, we have released the Granulate’s continuous profiler, an open-source continuous profiler.
Benefits of Continuous Profiling
Profiles provide great benefits by helping developers solve performance problems in an automatic and relatively cheap way via profiling reports that offer up valuable information about an application’s behavior in production. This data allows developers to analyze and get a better understanding of areas of code that are hot spots, which they can then start optimizing to resolve issues, reduce costs, enhance the user experience, and improve scalability.
Most profilers support different types of profiling data, namely:
- CPU time: time spent running on the CPU
- CPU percentage- percentage of CPU consumed
- Memory allocation: amount of allocated memory
- Wall time: time spent to finish a certain flow or task
In summary, code profilers give you an automated approach to highlight the root causes of performance problems and provide actionable insights for fixing them.
Continuous Profiling Techniques
Profiling has to be an ongoing and iterative process to gain performance wins; furthermore, you should focus your profiling efforts in the production environment where performance issues are found, as in most cases, optimization of local or development environments does not help resolve them.
Microbenchmarking certain parts of an application is sometimes feasible, but it also typically fails to replicate the workload and the actual behavior of the application in production. This makes continuous profiling an essential process of the modern application development lifecycle because it helps developers identify performance bottlenecks and deliver optimizations that truly matter.
Types of Profilers
The code profilers available are mainly categorized under two types: sampling and instrumenting profilers.
Sampling Profilers
Sampling profilers, also known as statistical profilers, work by approximating the “time spent” distribution in an application by collecting different time-point samples. Typically, a profiling agent periodically polls the profiled application by recording the current call stack; this determines the routine being executed and collects CPU utilization, memory usage, and latency data.
Instrumenting Profilers
Instrumenting profilers work by updating the application code and injecting calls into functions that will calculate how many times a procedure was called and how much time was spent inside a function. The overhead associated with this performance analysis is often high because of having to insert instrumentation directly into the profiled application code.
Choosing a Profiling Tool
There are four major code profilers on the market today; below, we will describe the technical specifications and differences between them.
1. Google Cloud Profiler
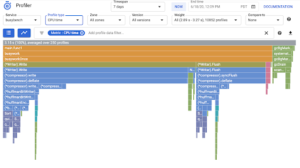
Google Cloud Profiler is a statistical and low-overhead profiler that is designed to continuously collect the CPU usage or memory allocation for an application in production. It associates the profiling information to the line of code/methods that generated it, which helps discover which areas of the application are consuming the most resources. This cloud profiler consists of a profiling agent and interface, where the agent is attached to a profiled application in the form of a library. It then periodically collects the profiling data for the running application, which can be viewed via an interface with two graphical elements: a flame graph and a visualization of average resource usage. The following figure is an example of Google Cloud Profiler data in the form of a flame graph:

Figure 1: Cloud profile interface (Source: GCP)
Cloud Profiler supports Java, Go, Node.js, and Python and can be used by developers to profile applications running on Google Cloud, other cloud platforms, or on-premises.
2. Datadog Continuous Profiler
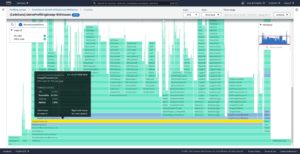
Datadog offers a continuous profiling service that can discover lines of code that have the highest CPU usage or memory allocation. For example, the following figure (a flame graph) displays the time each method spent executing on the CPU:

Figure 2: Datadog profiling flame graph of CPU usage per function (Source: Datadog)
The profiler is shipped with Datadog agents that run on the application’s host. It supports applications written in Java, Python, and Go, but the types of profiling data you get differ based on the language; for instance, collecting the time used per function in the CPU is available in all languages but the profiling data for the time each method spends reading from and writing to files (file I/O) is only provided for Java applications.
3. Amazon CodeGuru
CodeGuru Profiler helps developers understand the runtime behavior of an application and find the most expensive lines of code. You can use it to troubleshoot performance issues like high latency or low throughput by finding opportunities to improve CPU and memory utilization. As shown in the following figure, CodeGuru profiles show the estimated cost of running inefficient code:

Figure 3: CodeGuru flame graph visualizations and recommendations for demo Java application (Source: AWS)
CodeGuru Profiler helps to analyze CPU utilization, heap usage, and the latency characteristics of an application. It has a low overhead, so it can be used to continuously run in production, enables the discovery of performance issues, and provides ML-powered recommendations on how to identify and optimize the most expensive or resource-intensive methods within the application’s code. CodeGuru supports Java and Python applications.
4. Dynatrace Code Profiler
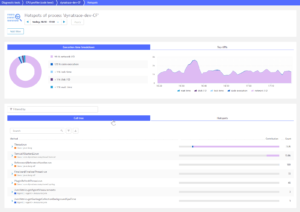
Dynatrace provides code-level diagnostic tools that can highlight problematic areas causing CPU or I/O bottlenecks. It offers CPU and memory profiling tools that allow developers to drill down to the method-level to detect problems; for example, the following figure shows the biggest consumers of CPU:

Figure 4: Dynatrace locates problematic methods (Source: Dynatrace)
Dynatrace uses patented PurePath technology based on code-level traces that span an end-to-end transaction. These code-level analysis tools support applications written in Java, .NET, PHP, Node.js, and Golang.
Analysis of Profiling Data
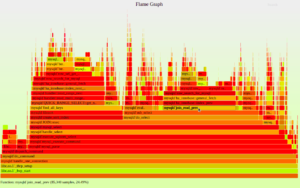
Most profiling tools visualize data in the form of flame graphs, which are mainly stack traces collected via sampling. For example, a CPU flame graph shows the CPU consumed by sampled functions, as seen in the following figure:

Figure 5: CPU flame graph (Source: BrendanGregg.com)
Each frame (rectangle) represents a function, ordered vertically (y-axis) from top to bottom, showing the call stack hierarchy of methods. The key indication of a frame is its width, as that represents the resource usage, which can help identify what methods are consuming the most CPU or memory. Usually, the colors on a flame graph are not significant to the performance information and are only used to correlate methods to their packages and to indicate the runtime of a given function. Horizontally (x-axis), methods are arranged alphabetically, not based on the time of execution.
In the example above, mysqld`do_select calls mysqld`sub_select, and the total CPU time of mysqld`do_select is defined to be the total CPU time of itself plus the CPU time of mysqld`sub_select.
Profiling Considerations
Traditional profiling tools or techniques can be resource-intensive with high overhead, which makes using them practical only for short durations. This means that to achieve constant visibility of application performance, the additional load of profiling must be minimal so that developers can effectively identify and resolve performance bottlenecks as they arise in production environments.
An additional consideration that made many developers refrain from using code profiling was the heavy lifting associated with initializing traditional profilers; the installations included modifications to the source code.
Summary
In this article, we described the profiling techniques and tools designed to run continuously in an application’s production environment. Continuous profiling is an effective way of finding where resources, such as CPU and memory, are being consumed the most by a component, method, or line of code. This allows developers to understand the runtime behavior of the profiled application and provide actionable insights for performance improvements.
On a personal note, we have recently launched a continuous profiler that was incubated as an internal tool in Granulate.
What makes our profiler unique?
- Open-source: An open-source package for community use
- Plug and play installation: Seamless installation without code changes and minimal effort
- Immediate visibility: Facilitates immediate visibility into production code – up and running in less than 5 minutes
- Low overhead: Minimal performance overhead, less than 1% utilization penalty
- Continuous: Designed to work continuously, facilitating effective analysis of performance issues in all environments, in real time
- Wide coverage: Native support for Java, Go, Python, Scala, Clojure, and Kotlin applications
Try it out, Would love to hear your thoughts on the product.
Want to learn more about code profiling? Please have a look at our next blog in the series: Using Code Profiling to Optimize Costs.
