

What Is Elastic Application Performance Monitoring?
Elastic Application Performance Monitoring (APM) is a solution that helps developers and IT operations teams monitor and optimize the performance of applications. It is part of the Elastic Stack and based on tools like Elasticsearch and Kibana. Elastic APM provides end-to-end visibility into application behavior, enabling users to track performance metrics, detect bottlenecks, and identify issues before they impact end-users.
By collecting detailed performance data from various components of an application, Elastic APM allows for in-depth analysis and troubleshooting. By integrating into the Elastic Stack, users can correlate APM data with logs, metrics, and security information. It supports a range of programming languages and frameworks, with functionalities such as error tracking, request and transaction monitoring, and service maps that visualize dependencies within an application.
In this article:
Elastic APM Key Features
Elastic APM offers the following features:
- Real User Monitoring (RUM): Captures and analyzes the performance of web applications from the end-user’s perspective. By monitoring metrics such as page load times, user interactions, and errors, RUM provides insights into how users experience the application.
- Distributed tracing: Enables the tracking of requests as they traverse through different services and components of a distributed system. This helps in pinpointing where latencies or errors occur, speeding up root cause analysis and resolution.
- Transaction sampling: Allows for the collection and analysis of a subset of transactions, providing a representative view of application performance without overwhelming the system with data. By intelligently sampling transactions based on predefined criteria, it ensures that critical performance insights are captured while maintaining efficiency and reducing overhead.
- Logging integration: Integrates with logging capabilities within the Elastic Stack, correlating logs with APM data for a holistic view of application performance. This allows users to trace errors and performance issues back to log events, providing context and accelerating troubleshooting efforts.
- Data security: Ensures the security of performance data robust encryption mechanisms in transit and at rest. Adheres to industry-standard security practices to protect sensitive information, including PII (Personally Identifiable Information). Access controls and audit logs monitor and manage who can view and interact with the data.
Getting Started with Elastic APM
These instructions are adapted from the official Elastic documentation.
Prerequisites
To start using Elastic APM, ensure that you have an Elastic Stack deployment, which includes:
- Elasticsearch: Enables storing and searching of data.
- Kibana: Visualizes and helps manage data.
- A Kibana user: Should have all Fleet and Integrations privileges, given that assets are often shared across spaces.
- Integrations server: This is included by default in the Elasticsearch Service deployment.
To expedite the setup, you can deploy the hosted Elasticsearch service, available on AWS, GCP, and Azure.
Step 1: Configuring APM Integration
Elastic Cloud offers a hosted Integrations server that includes the APM integration. Follow these steps to configure it:
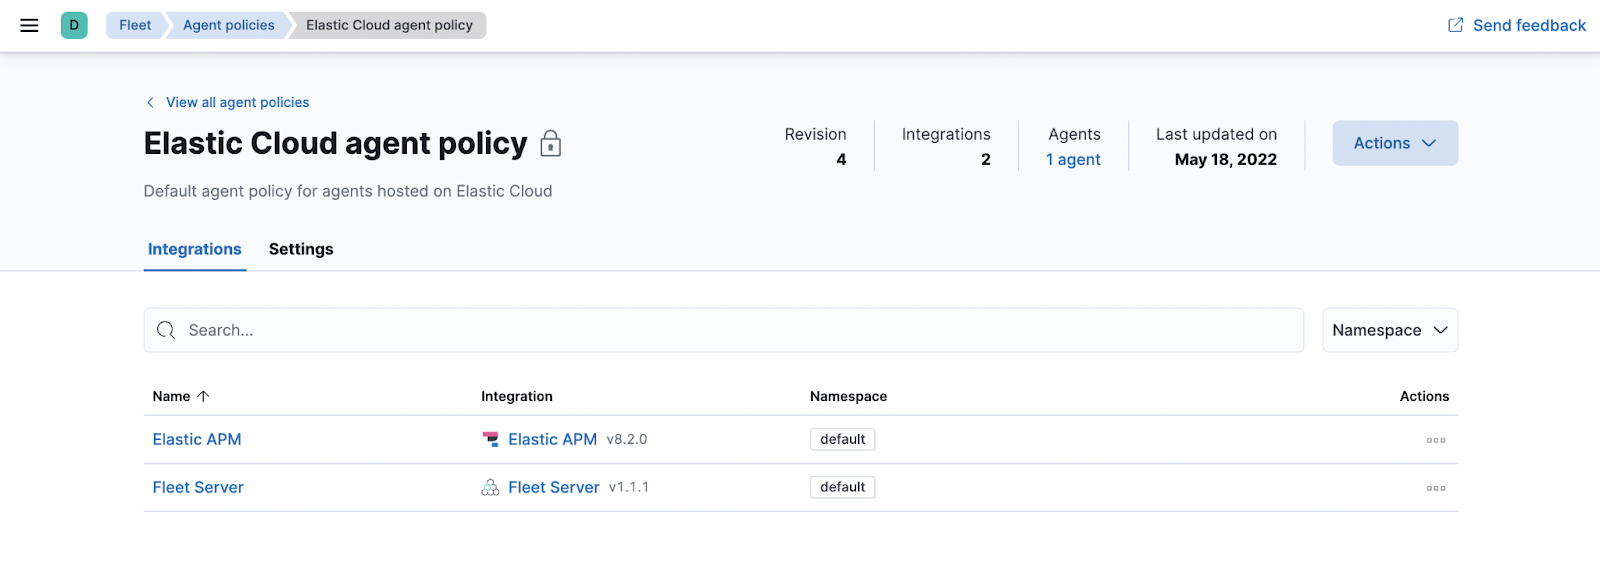
- In Kibana, go to Fleet and then Agent policies, and select Elastic Cloud agent policy. This policy is the default for agents hosted on Elastic Cloud.
- In the Actions column next to Elastic APM, click on Edit integration.
- Note the predefined URL that the APM Server listens on; you will need this for the next step.
- If you made any changes, click on Save and continue.
Step 2: Installing APM Agents
APM agents must be installed and configured in the same language as the service. Here’s how to do it:
- Download the APM agent: Retrieve the agent JAR from Maven Central. Use the following curl command:
curl -o ‘elastic-apm-agent.jar’ -L
‘https://oss.sonatype.org/service/local/artifact/maven/redirect?r=releases&g=co.elastic.apm&a=elastic-apm-agent&v=LATEST’
- Add the JVM flag: When starting your application, add the -javaagent flag:
java -javaagent:/path/to/elastic-apm-agent-<version>.jar -Delastic.apm.service_name=my-cool-service -Delastic.apm.application_packages=org.example,org.another.example -Delastic.apm.server_url=http://127.0.0.1:8200 -jar my-application.jar
- Configure the agent: Set the service name, APM Server URL, and secret token to match your APM integration settings. Alternatively, you can set up the agent using the apm-agent-attach-cli.jar for automatic setup or via a programmatic API for self-attachment.
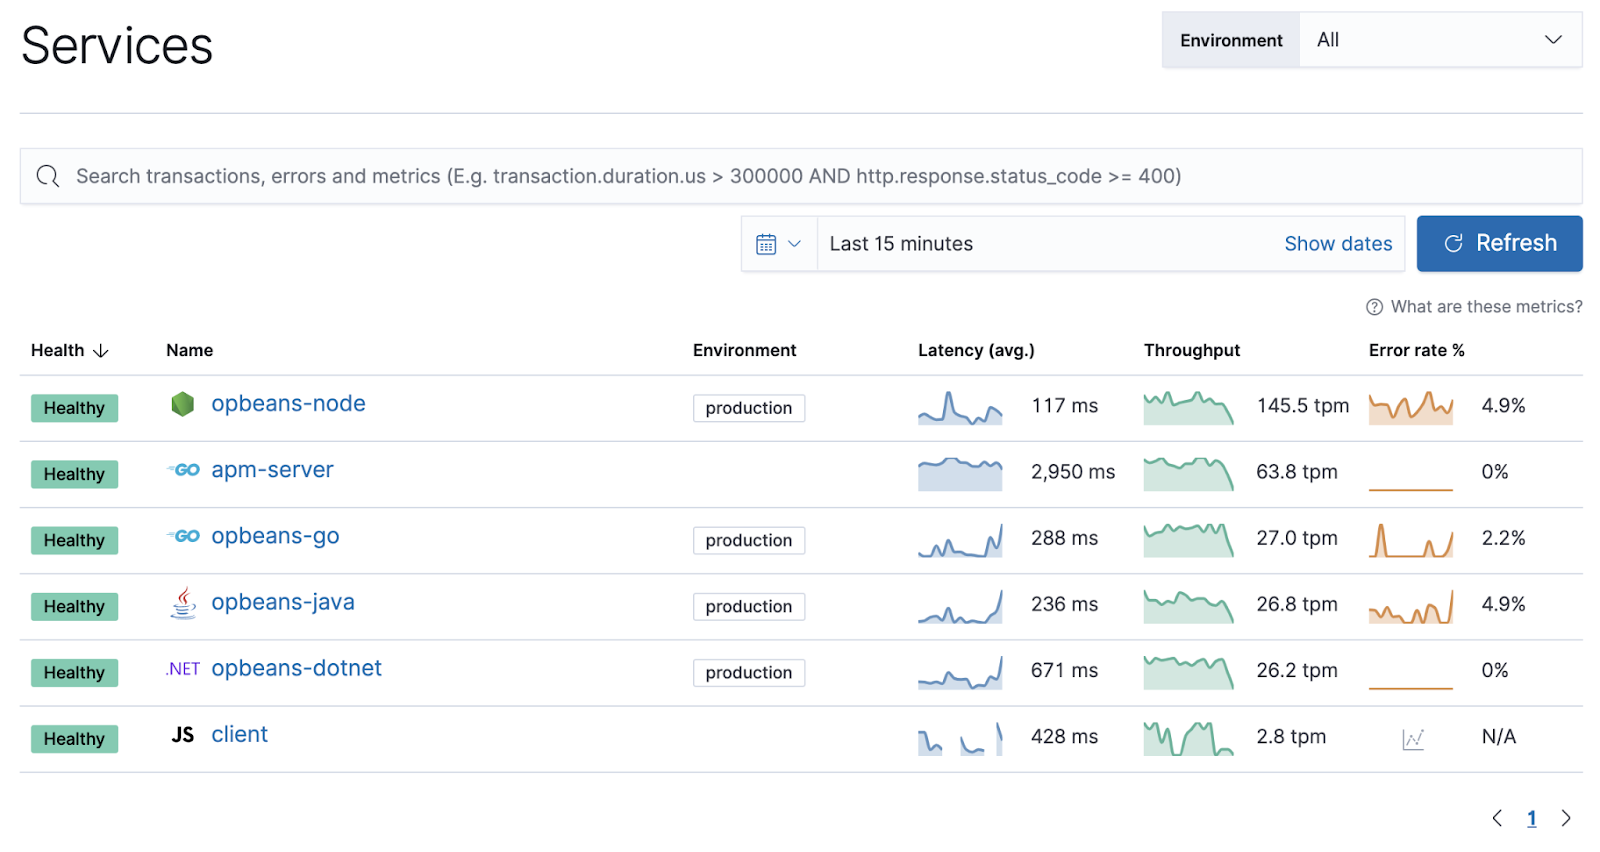
Step 3: Viewing the Data
In Kibana, navigate to Observability > APM. The Elastic Stack should show monitoring data, providing insights into the application’s performance.
| Tips from the expert:In my experience, here are a few ways to make better use of Elastic APM in your organization: – Correlate APM data with infrastructure metrics: Integrate APM data with infrastructure metrics (CPU, memory, network) collected from tools like Metricbeat. This correlation helps identify whether performance issues are application-specific or related to underlying infrastructure. – Implement custom instrumentation: Beyond automatic instrumentation, write custom spans and transactions for critical business processes. This provides deeper insights into specific application logic that might not be captured by default. – Use index lifecycle management (ILM): Set up ILM policies to manage the lifecycle of your APM data. This ensures that older, less critical data is archived or deleted, keeping storage costs under control while maintaining performance. – Optimize sampling strategies: Refine transaction sampling strategies to focus on high-value transactions. Dynamic sampling can be implemented to adjust the rate based on current system load, ensuring critical data is always collected during peak times. – Optimize APM agent configurations: Regularly review and tune APM agent configurations for each service. Adjust settings such as sampling rate, transaction and span types to be collected, and data retention policies to balance performance impact and data fidelity. |
Elastic APM Limitations
It’s also important to be aware of the limitations of Elastic Application Performance Monitoring, as reported by users on the G2 platform:
- Integration complexity: Integrating Elastic APM with application systems often requires a deep understanding of both the Elastic Stack and the application’s architecture. While the Elastic support team can provide assistance, this does not eliminate the initial setup difficulties that some users might face.
- Time frame setting issues in Kibana: Users have reported that specifying time frames like “Now” requires multiple clicks instead of a more intuitive single-click process. This can be frustrating when trying to perform quick analyses or troubleshooting.
- Unhelpful documentation: Users have reported that the documentation does not always provide the necessary details to fully understand and configure the tool, leading them to rely on trial and error and making it more difficult to access advanced features.
- KQL learning curve: The Kibana Query Language (KQL) used in Elastic APM can be difficult to grasp for new users, adding to the learning curve of the tool. KQL requires users to learn specific syntax and query structures, which can be challenging for those without prior experience.
Related content: Read our guide to performance optimization