

What Are Application Performance Management (APM) Tools?
Application Performance Management (APM) tools help developers and IT operations teams ensure that their applications run smoothly and efficiently. They monitor and manage the performance and availability of software applications, providing insights into potential bottlenecks, issues, and areas for improvement.
APM tools collect and analyze data from various sources within an application’s ecosystem, including servers, databases, and user devices. This data helps identify the root causes of performance issues, enabling teams to prevent downtime and optimize application performance. Typical users of APM tools include software developers, DevOps teams, and IT operations professionals.
This is part of a series of articles about application performance monitoring.
In this article:
Key Features of APM Tools
APM tools typically offer the following capabilities:
- End-user experience monitoring: Focuses on measuring and analyzing the performance of an application from the user’s perspective. Captures metrics such as page load times, transaction response times, and error rates.
- Runtime application architecture discovery and modeling: Provides a dynamic visualization of an application’s architecture. Automatically detects and maps out the components and dependencies within an application, such as microservices, databases, and third-party services.
- User-defined transaction profiling: Allows teams to monitor specific transactions or workflows within an application. Enables the definition of key business transactions, such as user logins, checkouts, or data queries, and tracks their performance metrics.
- Component monitoring: Focuses on tracking the performance and health of individual application components, such as servers, databases, and microservices. Collects metrics like CPU usage, memory consumption, and response times for each component.
- Alerting and incident management: Notifies teams of performance issues and helps them respond quickly. Users can set thresholds for different performance metrics, such as response times or error rates. When these thresholds are exceeded, the APM tool generates alerts to inform the team of potential issues. Incident management workflows help organize and track the resolution process.
| Tips from the expert: Based on my experience, here are a few ways to make the most of APM tools: – Integrate APM with CI/CD pipelines: Embed APM tools into your continuous integration and continuous deployment pipelines. This allows for immediate detection and resolution of performance issues introduced during code changes, ensuring smoother releases and quicker rollbacks if necessary. – Implement service-level objectives (SLOs): Define and monitor service-level objectives (SLOs) for key application metrics. This helps align the performance monitoring with business goals and provides a clear standard for acceptable performance levels. – Correlate APM data with business metrics: Integrate APM data with business analytics tools to correlate application performance with business outcomes. Understanding how performance impacts revenue, customer satisfaction, or other key metrics can drive more effective prioritization and resource allocation. – Monitor third-party dependencies: Keep a close watch on third-party services and APIs that your application depends on. Performance issues with these services can directly affect your application’s performance, and having visibility into their health can aid in quicker diagnosis. – Use distributed tracing for microservices: Implement distributed tracing to get detailed insights into the performance of microservices architectures. This helps in pinpointing latency issues and understanding the flow of requests across different services. |
9 Notable Application Performance Management Tools
New Relic APM
New Relic APM offers a solution for monitoring application performance, helping organizations move from reactive incident response to proactive performance management. It provides full-stack visibility, real-time user insights, and debugging tools, enabling teams to maintain application health and enhance the user experience.
Features:
- Application monitoring: Provides a view of telemetry across the stack, enabling proactive performance management.
- Health insights: Quickly assess application health at every development stage and part of the stack with intuitive health indicators.
- Full-stack performance view: Provides code-level insights from logs to infrastructure, allowing teams to identify root causes.
- Real-time user insights: Tracks key transactions, browser activities, and synthetic checks, offering real-time data on user interactions and application performance.
- Golden metrics monitoring: Instantly visualizes key metrics and dependencies, providing alerts and error tracking to maintain optimal application health.
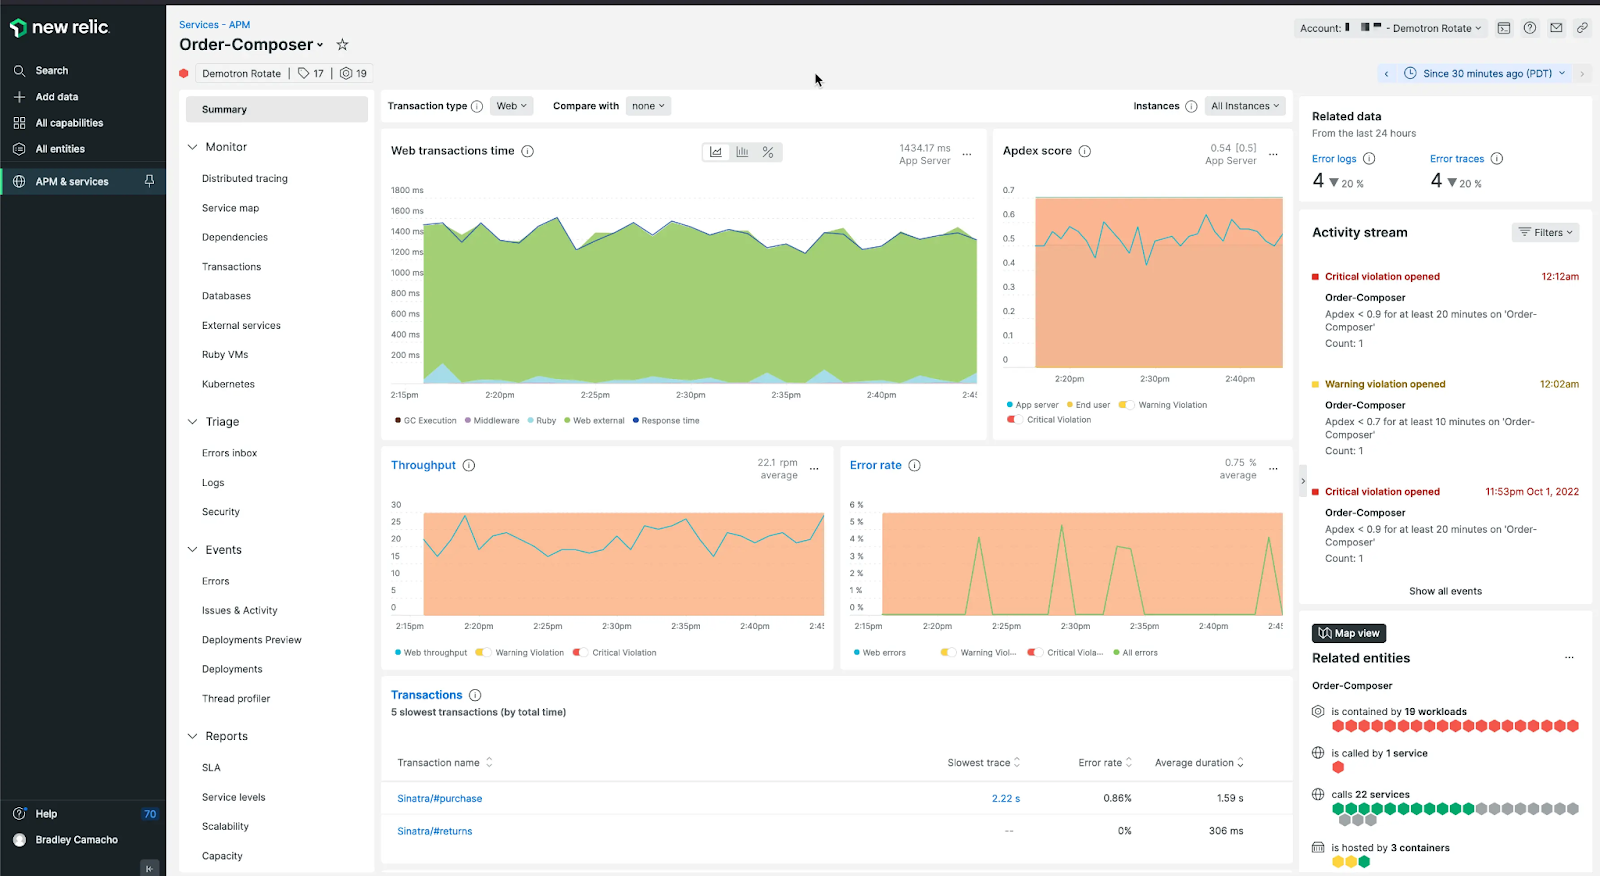
Source: New Relic
Elastic APM
Elastic APM monitors and optimizes the performance of applications. It provides visibility into the entire application stack, helping teams identify and resolve performance issues quickly. With features like distributed tracing, machine learning-based anomaly detection, and support for various architectures, it enables organizations to maintain high levels of performance.
Features:
- End-to-end distributed tracing: Allows users to capture and analyze distributed transactions across microservices, serverless functions, and monolithic architectures. This feature supports popular languages like Java, .NET, PHP, Python, and Go, and includes AWS Lambda auto-instrumentation.
- Sampling: Provides scalable, flexible architecture for 100% transaction sample capture, with the ability to adjust sampling rates as needed. Tail-based sampling allows for fine-grained control and optimal visibility.
- Automated dependency mapping: Visualizes all dependencies, including cloud services, messaging systems, and data stores.
- Machine learning and AIOps: Enables automatic anomaly detection and correlation of latency, errors, and failures. This aids in pinpointing intermittent issues that are hard to detect with traditional monitoring techniques.
- CI/CD pipeline visibility: Offers continuous visibility during deployments to identify performance changes. This feature helps trace issues back to specific releases or versions and integrates with CI/CD tools like Jenkins, Maven, and Ansible.
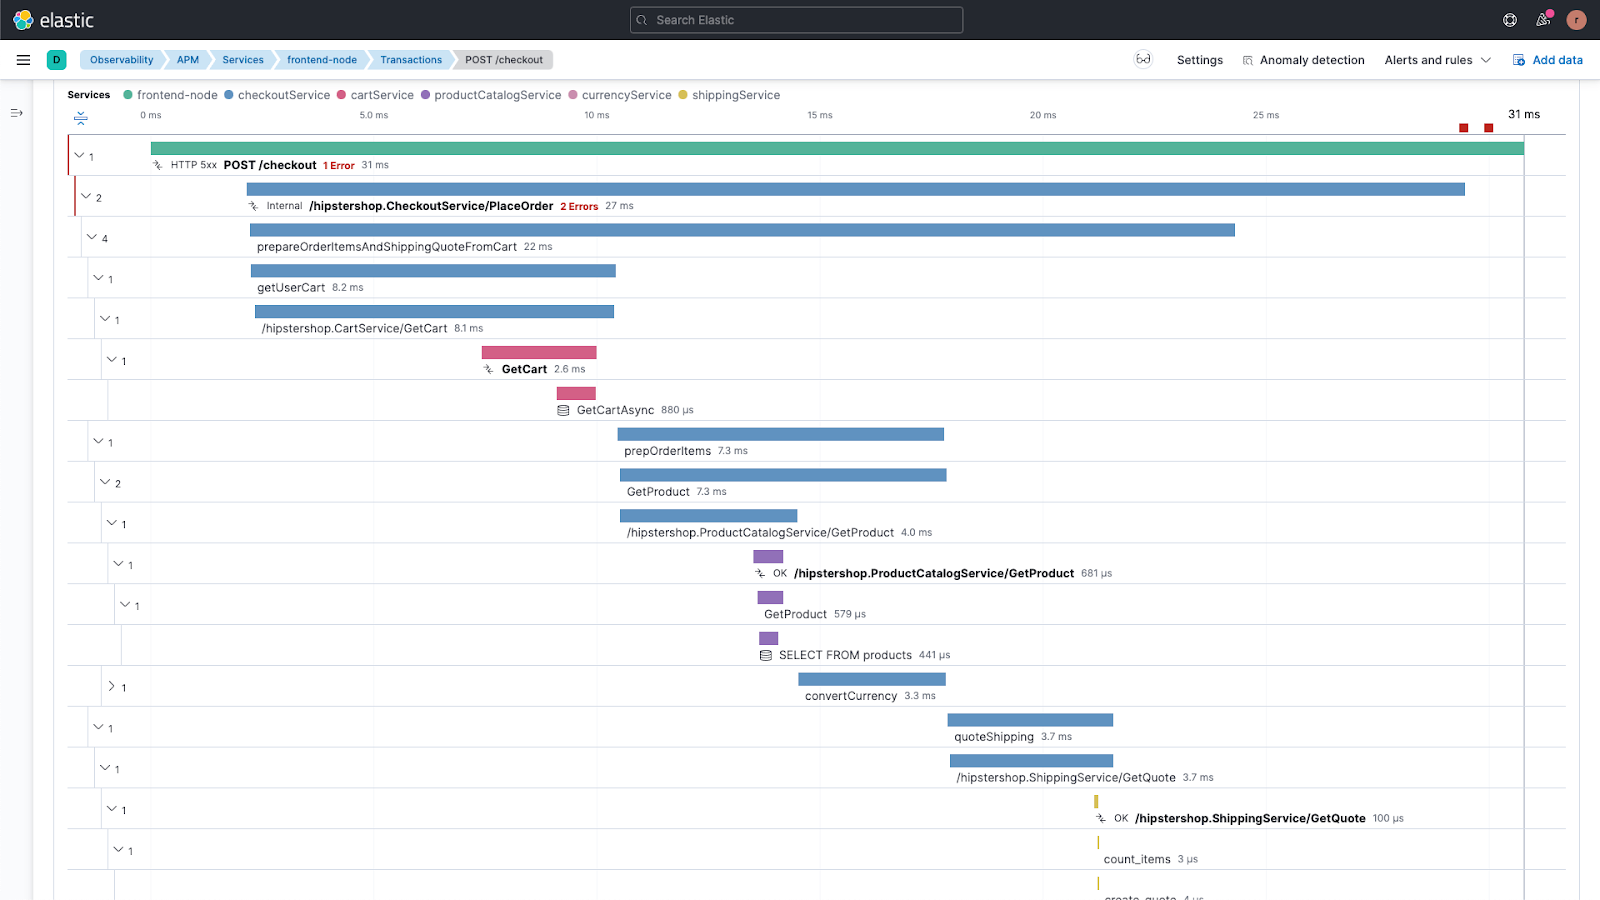
Source: Elastic
AppDynamics
AppDynamics APM offers insights into complex application environments, allowing IT teams and business leaders to make informed decisions. By providing real-time, contextual information from the code-level to the C-suite, AppDynamics helps organizations maintain high performance and improve user experiences.
Features:
- End-to-end observability: Provides visibility into code-level transactions affecting key business KPIs such as conversion rates and revenue.
- Machine learning-based anomaly detection: The Cognition Engine uses machine learning to automate the detection of anomalies, reducing mean time to resolution (MTTR).
- Hybrid environment management: Enables seamless migration to the cloud with real-time performance insights and simplifies management of hybrid environments through a consolidated view of application services and infrastructure.
- Agent automation: The Smart Agent simplifies application instrumentation with automated management, enabling quick onboarding of new applications, identifying out-of-date agents, and upgrading them through a centralized interface.
- Integrated log analysis: Log Observer Connect integrates Splunk log analytics with AppDynamics APM, allowing teams to share and analyze logs in context.
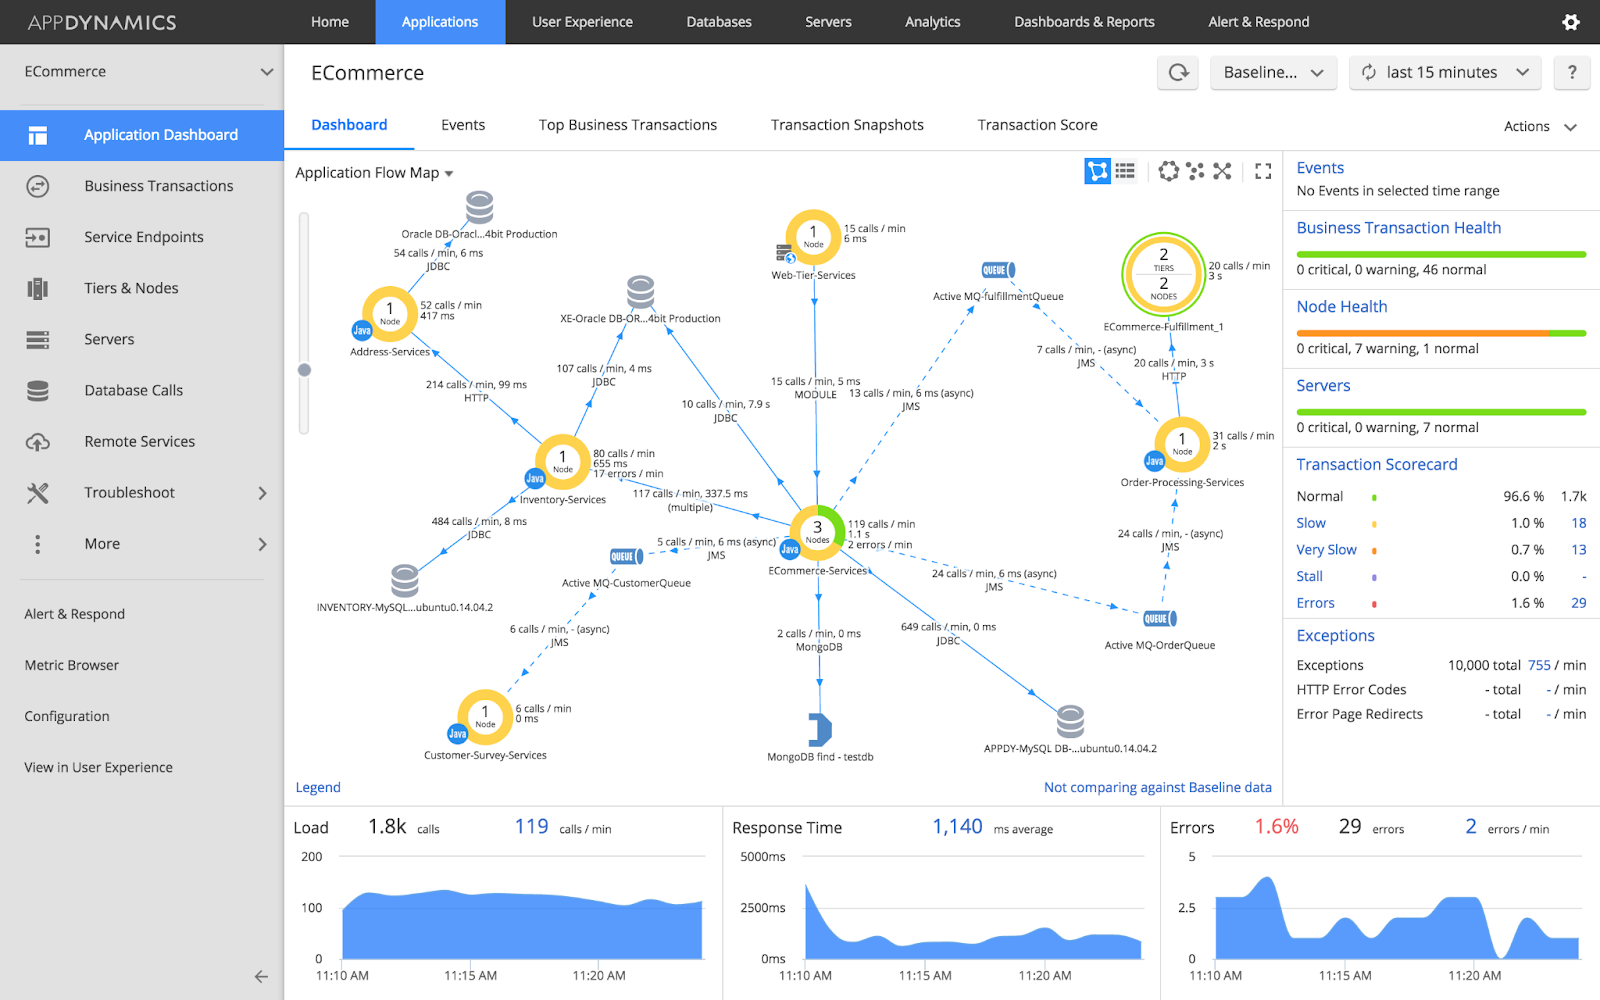
Source: AppDynamics
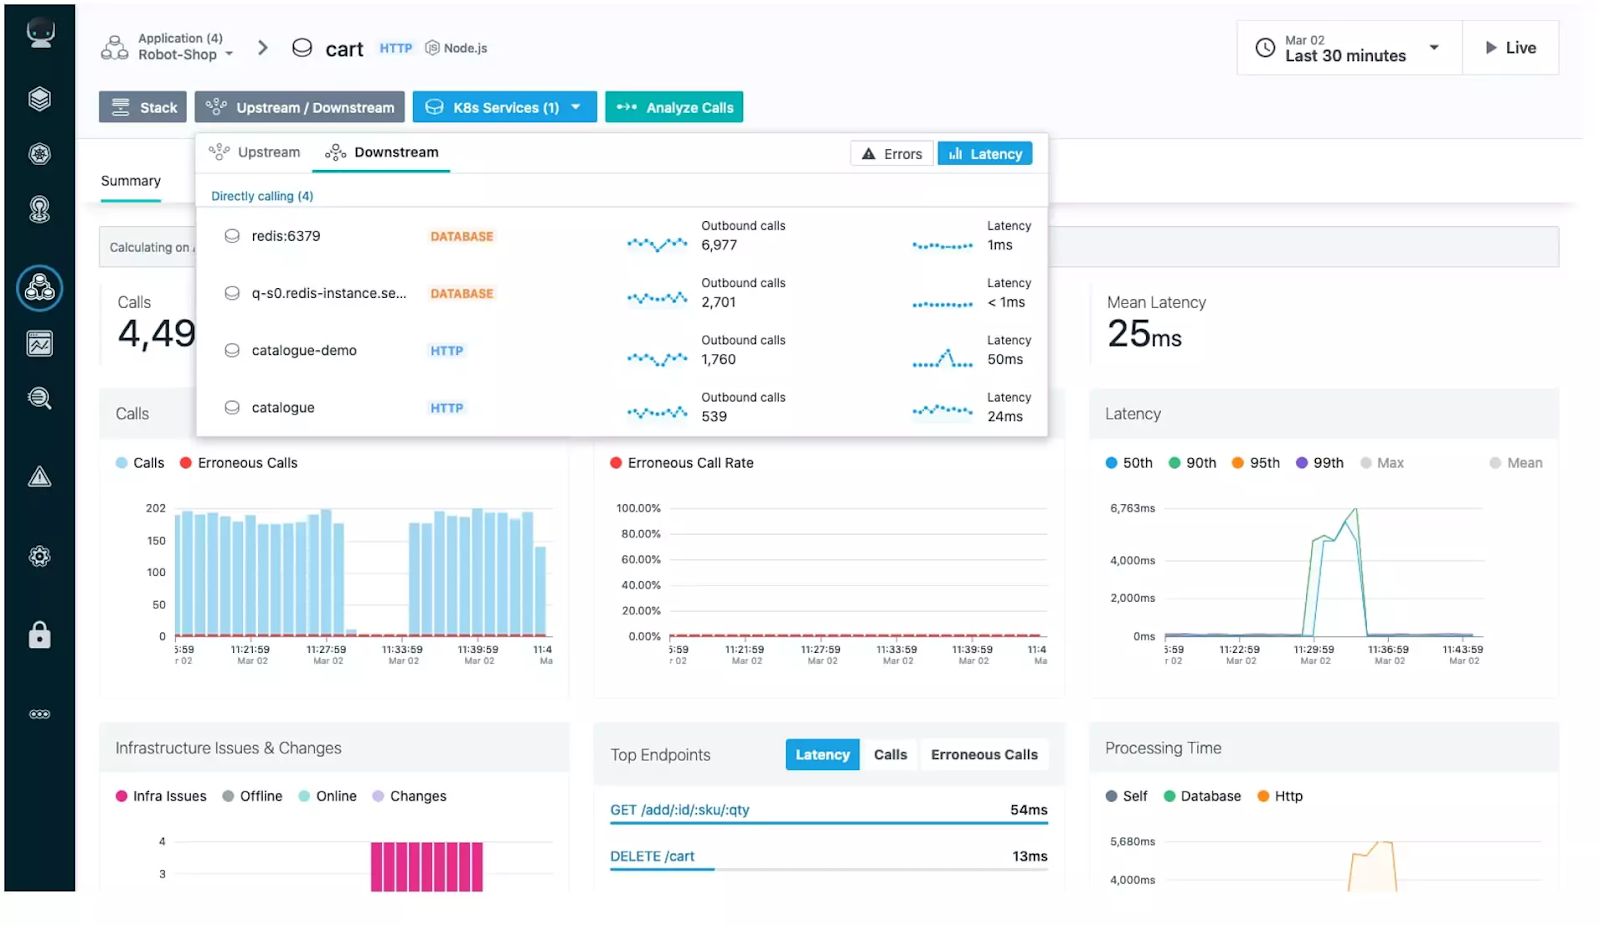
Datadog APM
Datadog APM provides monitoring, troubleshooting, and security for cloud-scale applications, using AI-powered, code-level distributed tracing. By correlating traces with logs, metrics, real user monitoring (RUM) data, and security signals, Datadog APM helps teams quickly identify and resolve issues, optimize performance, and improve the security of their applications.
Features:
- Code-level tracing: Enables distributed tracing from browser and mobile applications to backend services and databases, providing visibility into the execution time and resource consumption of every method, code line, and thread.
- Service observability: Offers a centralized view of health metrics and dependencies, allowing rapid detection of service issues by correlating traces with logs, infrastructure metrics, database queries, and frontend telemetry.
- Deployment tracking: Supports deployment strategies like canary and blue-green, tracking performance changes before, during, and after releases. This helps identify if a release is causing high error rates or latency.
- Embedded AI/ML: Uses Watchdog AI for automated root cause analysis, minimizing mean time to resolution (MTTR) with ML-based alerts that detect anomalies and predict future performance changes.
- Vulnerability detection: Secures cloud applications by identifying threats and vulnerabilities in production, enabling mitigation before they become breaches.
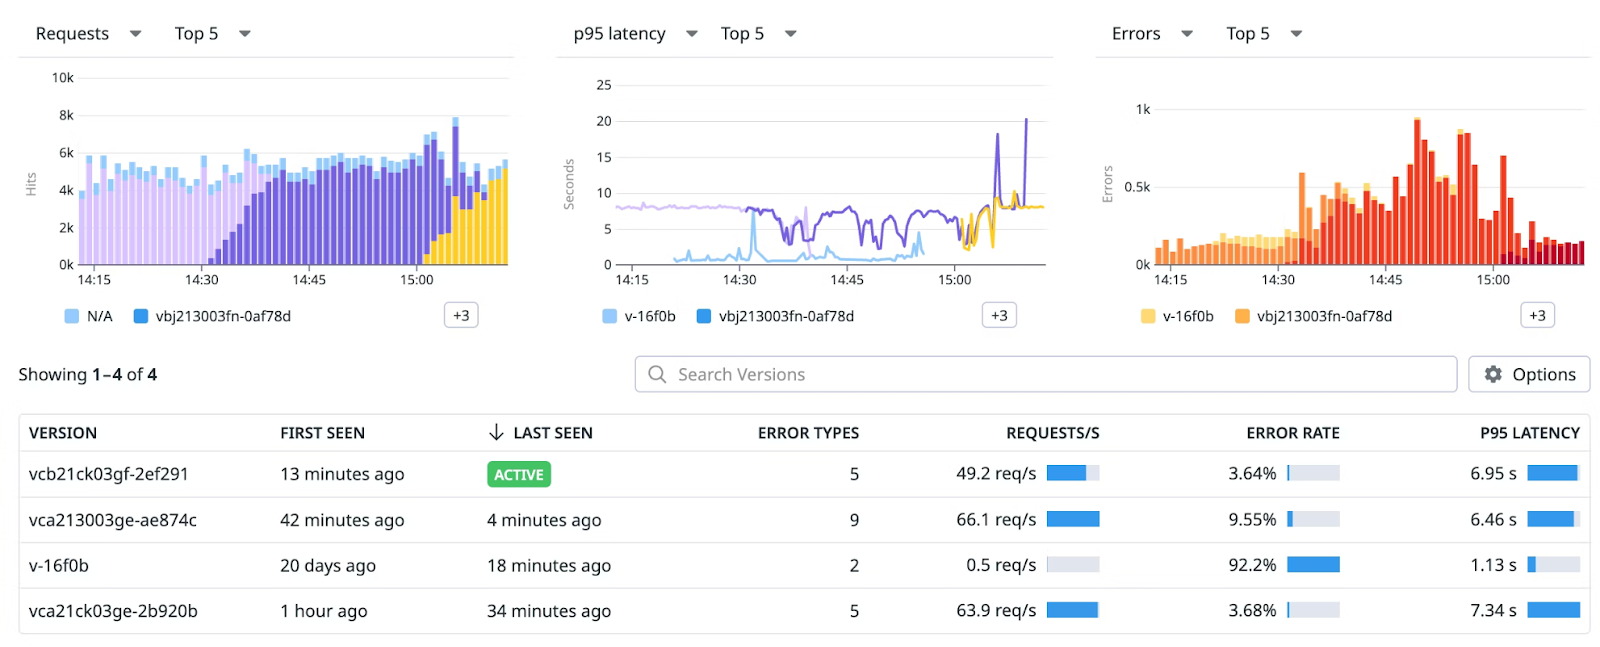
Source: Datadog
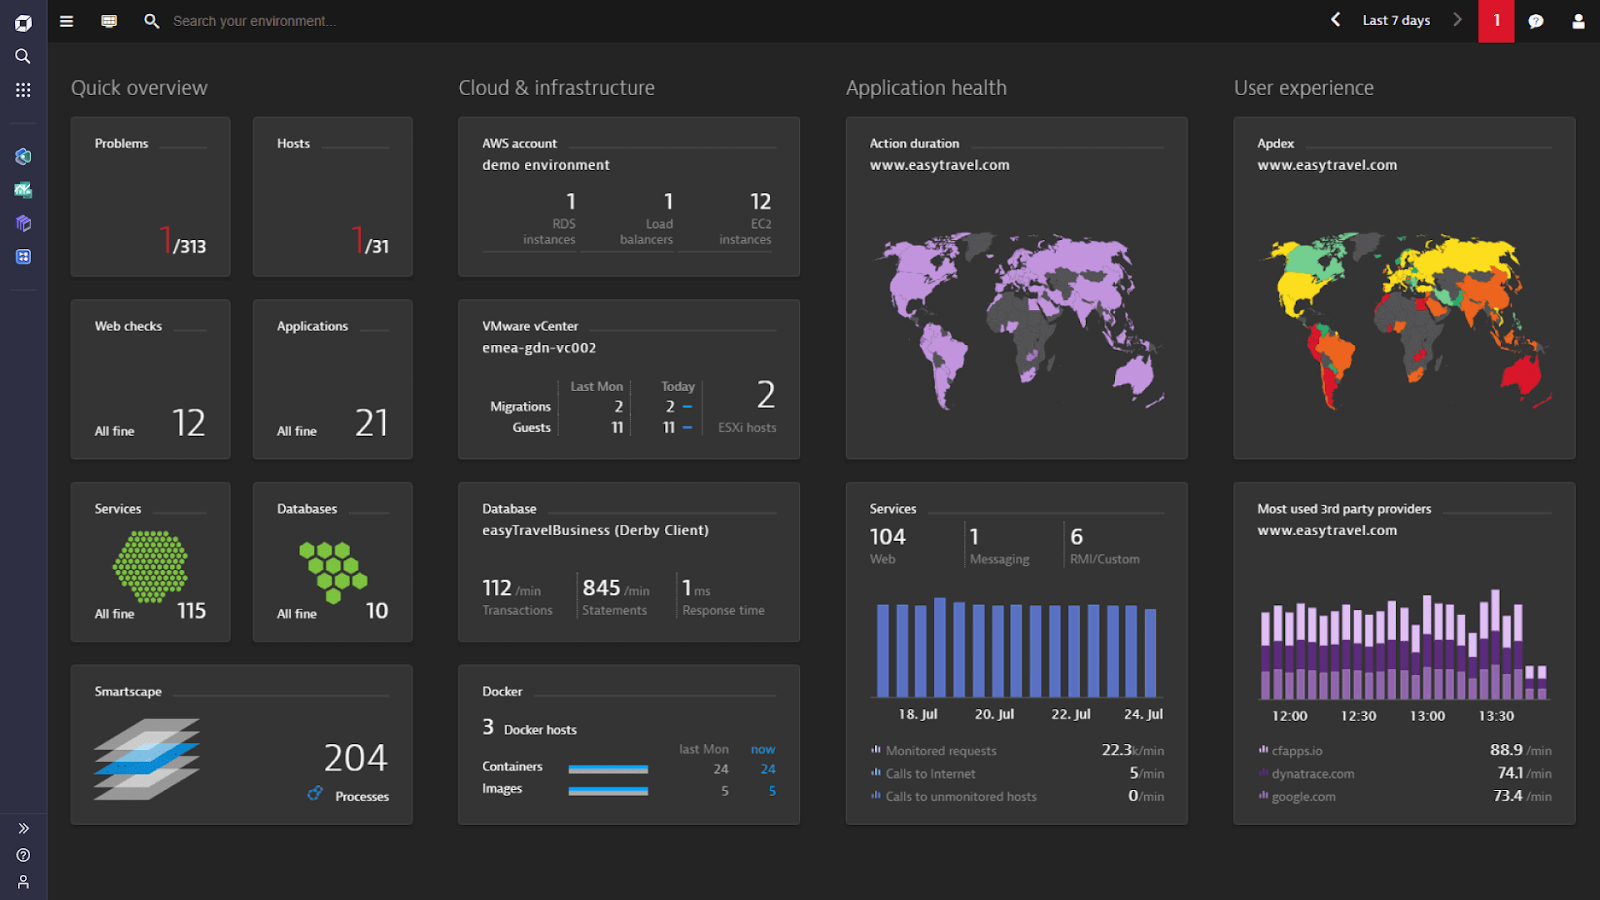
Dynatrace

Dynatrace APM provides application observability, ensuring optimal service performance and service level objectives (SLOs). Using automatic discovery and instrumentation, it aims to help organizations to innovate faster, collaborate more efficiently, and deliver applications with fewer resources.
Features:
- Cloud-native and enterprise stack support: Built to support AWS, Microsoft Azure, Google Cloud Platform, Linux, Windows, and IBMi, providing observability for diverse environments.
- Automatic discovery and instrumentation: Automatically discovers and instruments AWS Lambda and Kubernetes, continuously monitoring cloud-native workloads and microservices.
- Continuous topology discovery: Dynamically maps the entire application topology, ensuring up-to-date monitoring of all components.
- AI-powered root cause analysis: Uses AI to identify the root causes of performance issues and their impacts, helping teams resolve problems faster.
- Baselining and anomaly detection: Automatically baselines response times and error rates, enabling proactive identification of anomalies in serverless functions, container services, and Kubernetes workloads.
Source: Dynatrace
IBM Instana
IBM Instana offers a real-time, full-stack observability solution to prevent downtime with zero sample tracing. By providing automated observability enhanced with AI, IBM Instana aims to democratize performance monitoring, making it accessible to DevOps, SRE, platform engineering, ITOps, and development teams.
Features:
- Real-time full-stack observability: Delivers 1-second granularity for immediate detection of issues.
- Zero sample tracing Ensures full trace capture, allowing for issue detection and resolution without any data loss.
- Remediation: Uses Watsonx.ai to enhance application performance and resolve issues before they impact customers.
- Contextual data insights: Collects and contextualizes data from all sources, including OpenTelemetry, providing insights to manage change in modern applications.
- High-fidelity data collection: Offers accurate reporting and analytics with no gaps, shortening reaction times and improving decision-making.
- Automated observability: Uses automation for instrumentation, discovery, mapping, data visualization, analytics, and troubleshooting.
Source: IBM
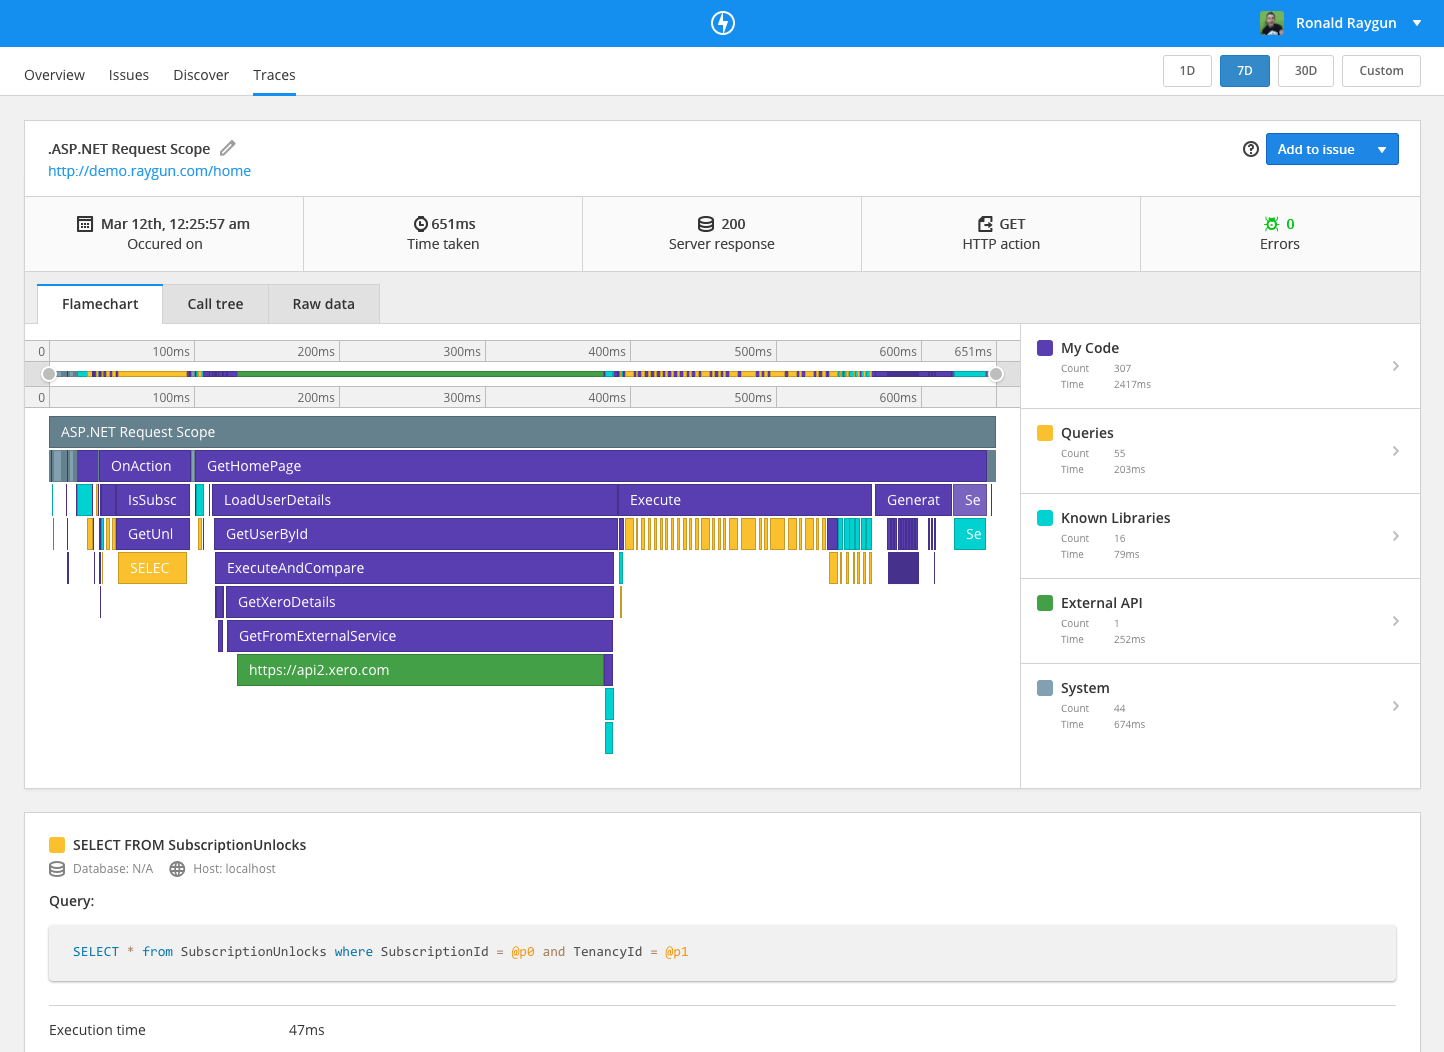
Raygun APM

Raygun APM offers visibility into server-side performance, providing code-level insights that help teams quickly identify and resolve issues. Its interface is designed to be accessible for both technical and non-technical staff.
Features:
- Server-side visibility: Provides greater detail into server-side performance than other leading APM solutions, enabling teams to uncover root causes faster.
- Support for multiple languages: Offers support for .NET, Ruby, and Node.js, ensuring compatibility with various application stacks.
- Simple setup: Easy-to-install agents provide control over data sampling, enabling quick deployment and configuration.
- Flexible pricing: Offers scalable pricing with no limits on the number of applications or team members, making it accessible for teams of all sizes.
- Code execution visualization: Allows users to observe how code is executed in real time, segmented by methods, requests, queries, and external API calls.
Source: Raygun
ManageEngine Applications Manager
ManageEngine Applications Manager is an application performance monitoring software that provides visibility into the performance and user experience of business-critical applications and infrastructure components. It helps organizations quickly identify and resolve performance issues across the application stack, from the URL to the line of code.
Features:
- Application performance monitoring: Helps monitor and troubleshoot application performance in development, QA, and production environments with code-level insights, distributed transaction tracing, and application service maps. Supports Java, .NET, .NET Core, Node.js, Python, PHP, and Ruby applications.
- Multi-cloud monitoring: Offers visibility into private, public, and hybrid cloud resources. Supports AWS, Azure, GCP, Oracle Cloud, and OpenStack.
- Database monitoring: Helps identify and resolve database issues impacting application performance with agentless monitoring for RDBMS (e.g., Oracle, SQL Server), NoSQL (MongoDB), in-memory (Memcached), and big data stores (Hadoop).
- Server monitoring: Helps monitor and troubleshoot server health and performance in physical, virtual, and cloud environments.
- Synthetic transaction monitoring: Tests the performance of critical user paths using Selenium-based scripting and browser checks from multiple locations.
Source: ManageEngine
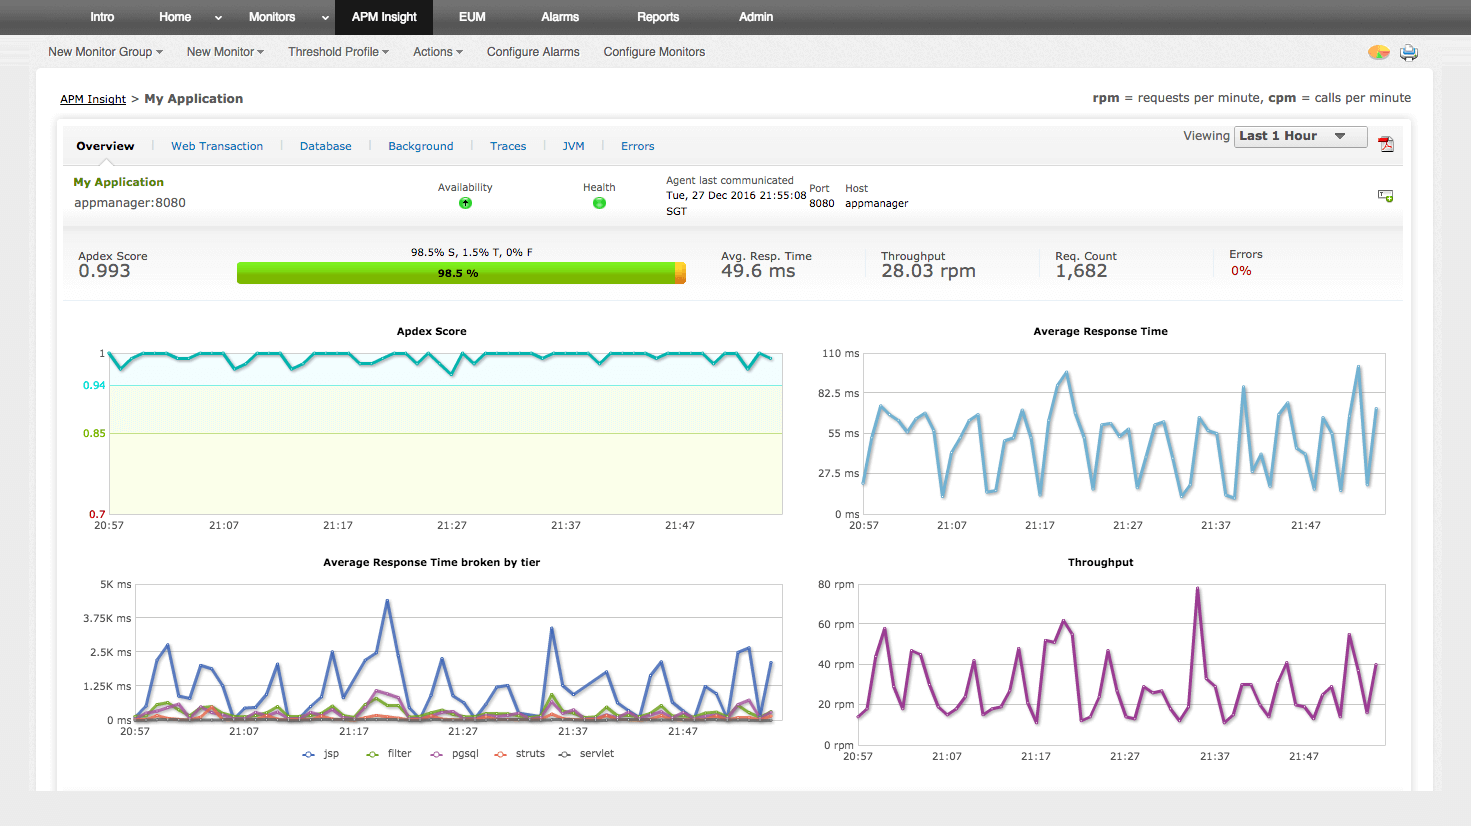
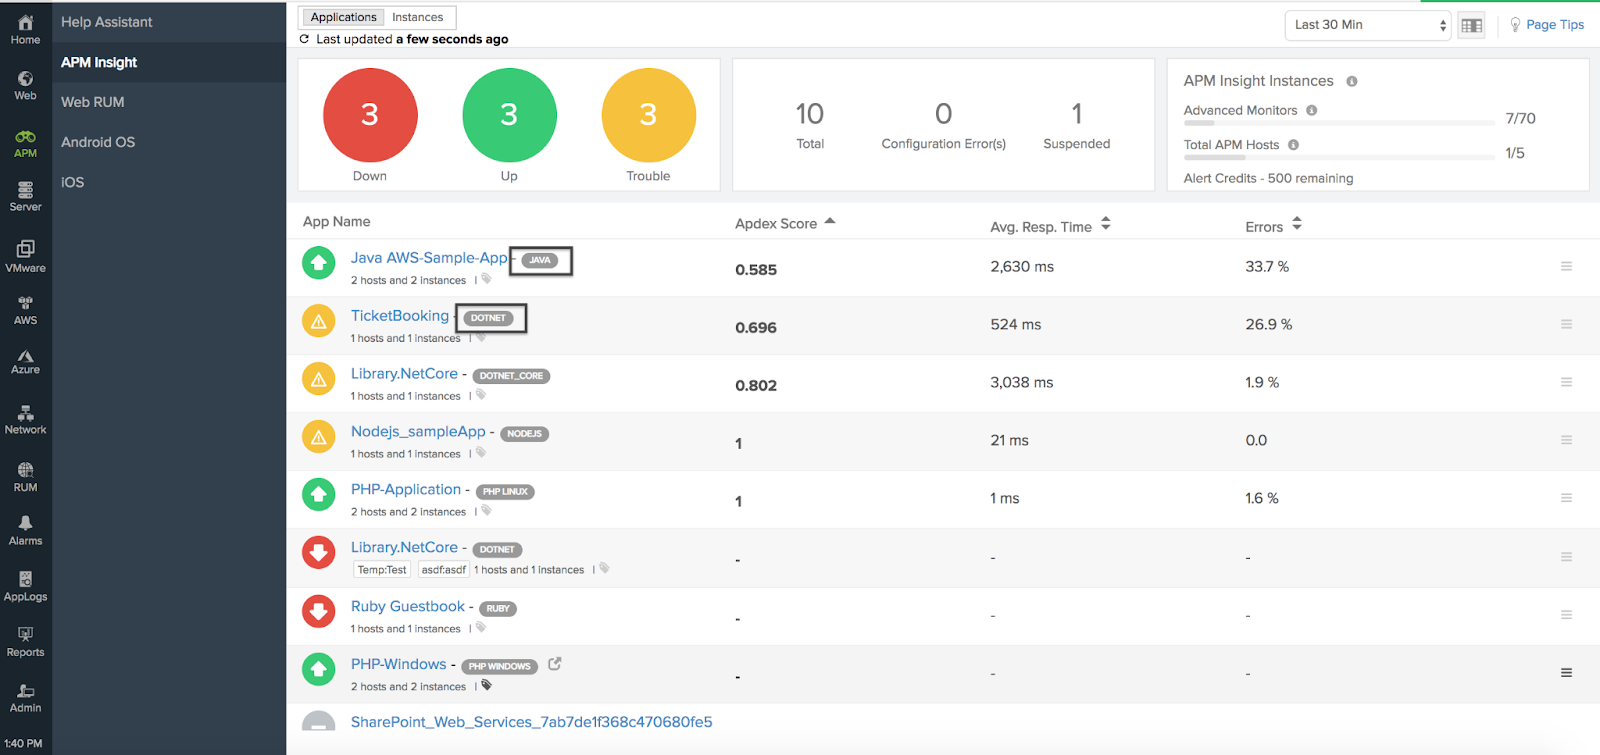
Site24x7 APM Insight
Site24x7 APM Insight offers a scalable, AI-powered solution for monitoring application performance. By tracking key metrics in real time, it aims to enhance application reliability, security, and performance, bringing organizations closer to achieving full observability.
Features:
- Enhanced user experience: Offers distributed tracing to monitor individual transactions across microservices and distributed architecture, improving overall user experience.
- Contextual debugging: Helps identify and troubleshoot errors, reducing mean time to detect (MTTD) and mean time to resolve (MTTR).
- Key metrics tracking: Helps measure user actions to identify potential bottlenecks that may affect the end-user experience.
- AI-powered troubleshooting: Uses AI for advanced troubleshooting, helping to quickly pinpoint and resolve issues.
- Comprehensive view: Provides real-time monitoring, ensuring complete visibility into application performance.
Source: Site24x7