
Answers to the 5 Most Common Cloud Cost-Optimization Questions
Cloud cost optimization isn't just about cutting expenses; it's investing smartly in cloud resources without sacrificing performance.
Sign up for our newsletter
Blog - Page 19 of 22
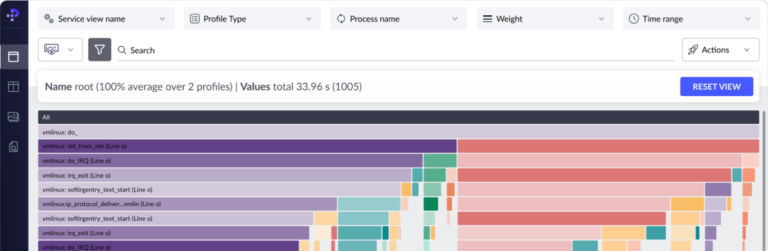
Using Code Profiling to Optimize Costs
In this blog, we cover code profiling and how to use profiling data (flame graphs) to optimize application performance and reduce costs.

Addressing the Trillion-Dollar Cloud Paradox
Granulate’s AI-driven real-time continuous optimization gives you a faster, less disruptive alternative to repatriation.

Granulate Named a Gartner Cool Vendor
Gartner has named Granulate as a “Cool Vendor” list for in Monitoring, Observability and Cloud Operations 2021

Mastering Performance Optimization
Performance optimization is the process of modifying a system to amplify its functionality, thus making it more efficient and effective.
Introduction to Continuous Profiling
Here is an overview of the application code profiling concepts, benefits and top profiling tools and considerations for different use cases.

Java Virtual Machine Garbage Collection and Its Performance Impact
This post covers the main concepts behind Java JVM garbage collection's impact on performance and some approaches to improve performance of Java...

Granulate’s Profiler Identifies Inefficiencies in Production Code
Granulate's new open-source continuous profiler enables organizations in production to identify bottlenecks and improve code quality.

How to Improve Your Java-Based Performance Results
Granulate Intel collaboration show new Java-based performance results, with significant improvement of 2nd Gen Intel Xeon Scalable processors

Understanding Congestion Control
In this post, we will discuss how to achieve congestion control in network layer via various algorithms and avoid congestive collapse.